
52 Week Low Stocks Based on Machine Learning: Returns up to 12.87% in 7 Days
52 Week Low Stocks
The 52 Week Low Stocks Package is designed for investors and analysts who need predictions for stocks currently at their 52-week low price level, offering the best market opportunities based on algo-trading. It includes 20 stocks with bullish and bearish signals and indicates the best stocks to invest in:
- 52 Weeks Low Top 10 stocks for the long position
- 52 Weeks Low Top 10 stocks for the short position

Package Name: 52 Week Low Stocks
Recommended Positions: Long
Forecast Length: 7 Days (5/11/21 – 5/18/21)
I Know First Average: 3.06%

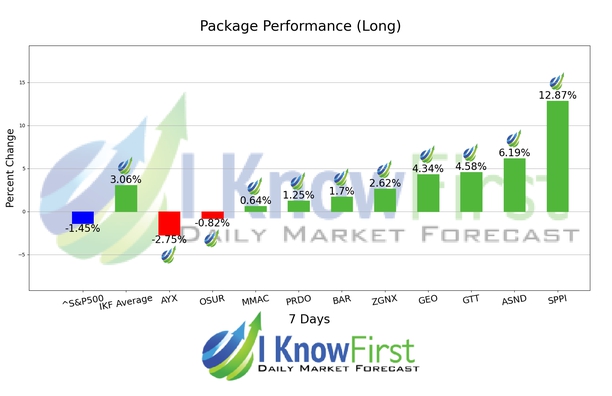
I Know First’s State of the Art Algorithm accurately forecasted 8 out of 10 trades in this 52 Week Low Stocks Package for the 7 Days time period. SPPI was our best stock pick this week a return of 12.87%. Other notable stocks were ASND and GTT with a return of 6.19% and 4.58%. With these notable trade returns, the package itself registered an average return of 3.06% compared to the S&P 500’s return of -1.45% for the same period.
Spectrum Pharmaceuticals, Inc. is a biotechnology company with fully integrated commercial and drug development operations with a primary focus in oncology. The Company’s strategy is comprised of acquiring, developing, and commercializing a broad and diverse pipeline of late-stage clinical and commercial products.
Algorithmic traders utilize these daily forecasts by the I Know First market prediction system as a tool to enhance portfolio performance, verify their own analysis and act on market opportunities faster. This forecast was sent to current I Know First subscribers.
How to interpret this diagram
Algorithmic Stock Forecast: The table on the left is a stock forecast produced by I Know First’s algorithm. Each day, subscribers receive forecasts for six different time horizons. Note that the top 10 stocks in the 1-month forecast may be different than those in the 1-year forecast. In the included table, only the relevant stocks have been included. The boxes are arranged according to their respective signal and predictability values (see below for detailed definitions). A green box represents a positive forecast, suggesting a long position, while a red represents a negative forecast, suggesting a short position.
Please note-for trading decisions use the most recent forecast. Get today’s forecast and Top stock picks.


