
52 Week Low Stocks Based on Data Mining: Returns up to 55.51% in 1 Month
52 Week Low Stocks
The 52 Week Low Stocks Package is designed for investors and analysts who need predictions for stocks currently at their 52-week low price level, offering the best market opportunities based on algo-trading. It includes 20 stocks with bullish and bearish signals and indicates the best stocks to invest in:
- 52 Weeks Low Top 10 stocks for the long position
- 52 Weeks Low Top 10 stocks for the short position

Package Name: 52 Week Low Stocks
Recommended Positions: Long
Forecast Length: 1 Month (9/13/2020 – 10/14/2020)
I Know First Average: 7.41%
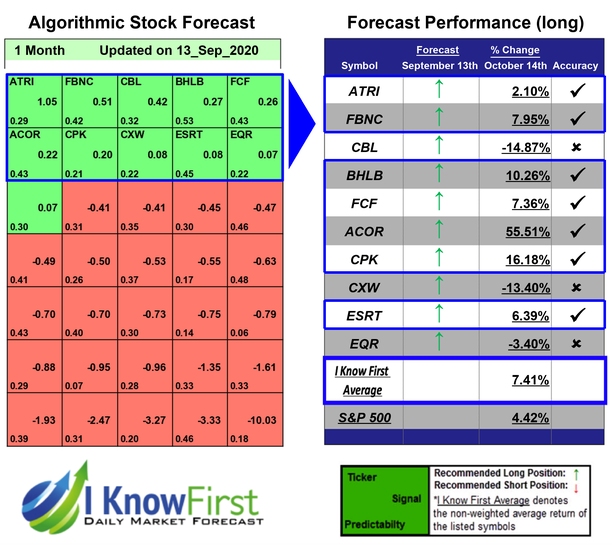
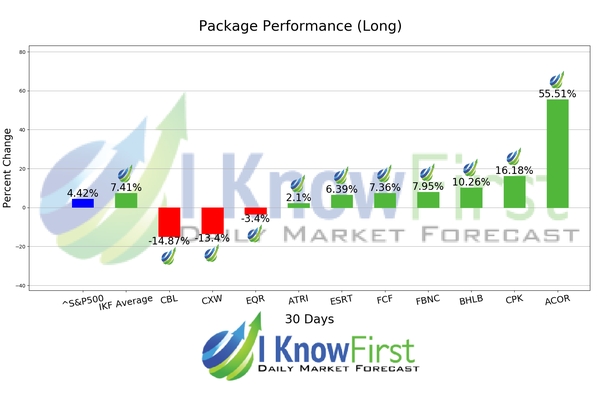
For this 1 Month forecast the algorithm had successfully predicted 7 out of 10 movements. The prediction with the highest return was ACOR, at 55.51%. CPK and BHLB saw outstanding returns of 16.18% and 10.26%. The overall average return in this 52 Week Low Stocks package was 7.41%, providing investors with a 2.99% premium over the S&P 500’s return of 4.42% during the same period.
Acorda Therapeutics, Inc., incorporated on March 17, 1995, is a biopharmaceutical company. The Company focuses on developing therapies that restore function and improve the lives of people with neurological disorders. As of December 31, 2016, the Company marketed three United States Food and Drug Administration (FDA)-approved therapies, including Ampyra (dalfampridine) Extended Release Tablets, 10 milligram (mg), a treatment to improve walking in patients with multiple sclerosis (MS). The Company also markets Zanaflex Capsules and tablets, FDA-approved as short-acting drugs for the management of spasticity, and Qutenza, an FDA-approved dermal patch for the management of neuropathic pain associated with post-herpetic neuralgia, also known as post-shingles pain. The Company has a pipeline of neurological therapies addressing a range of disorders, including Parkinson’s disease, migraine and MS.
Algorithmic traders utilize these daily forecasts by the I Know First market prediction system as a tool to enhance portfolio performance, verify their own analysis and act on market opportunities faster. This forecast was sent to current I Know First subscribers.
How to interpret this diagram
Algorithmic Stock Forecast: The table on the left is a stock forecast produced by I Know First’s algorithm. Each day, subscribers receive forecasts for six different time horizons. Note that the top 10 stocks in the 1-month forecast may be different than those in the 1-year forecast. In the included table, only the relevant stocks have been included. The boxes are arranged according to their respective signal and predictability values (see below for detailed definitions). A green box represents a positive forecast, suggesting a long position, while a red represents a negative forecast, suggesting a short position.
Please note-for trading decisions use the most recent forecast. Get today’s forecast and Top stock picks.


