
52 Week Low Stocks Based on Data Mining: Returns up to 45.32% in 3 Months
52 Week Low Stocks
The 52 Week Low Stocks Package is designed for investors and analysts who need predictions for stocks currently at their 52-week low price level, offering the best market opportunities based on algo-trading. It includes 20 stocks with bullish and bearish signals and indicates the best stocks to invest in:
- 52 Weeks Low Top 10 stocks for the long position
- 52 Weeks Low Top 10 stocks for the short position

Package Name: 52 Week Low Stocks
Recommended Positions: Long
Forecast Length: 3 Months (8/25/2019 – 11/26/2019)
I Know First Average: 24.85%
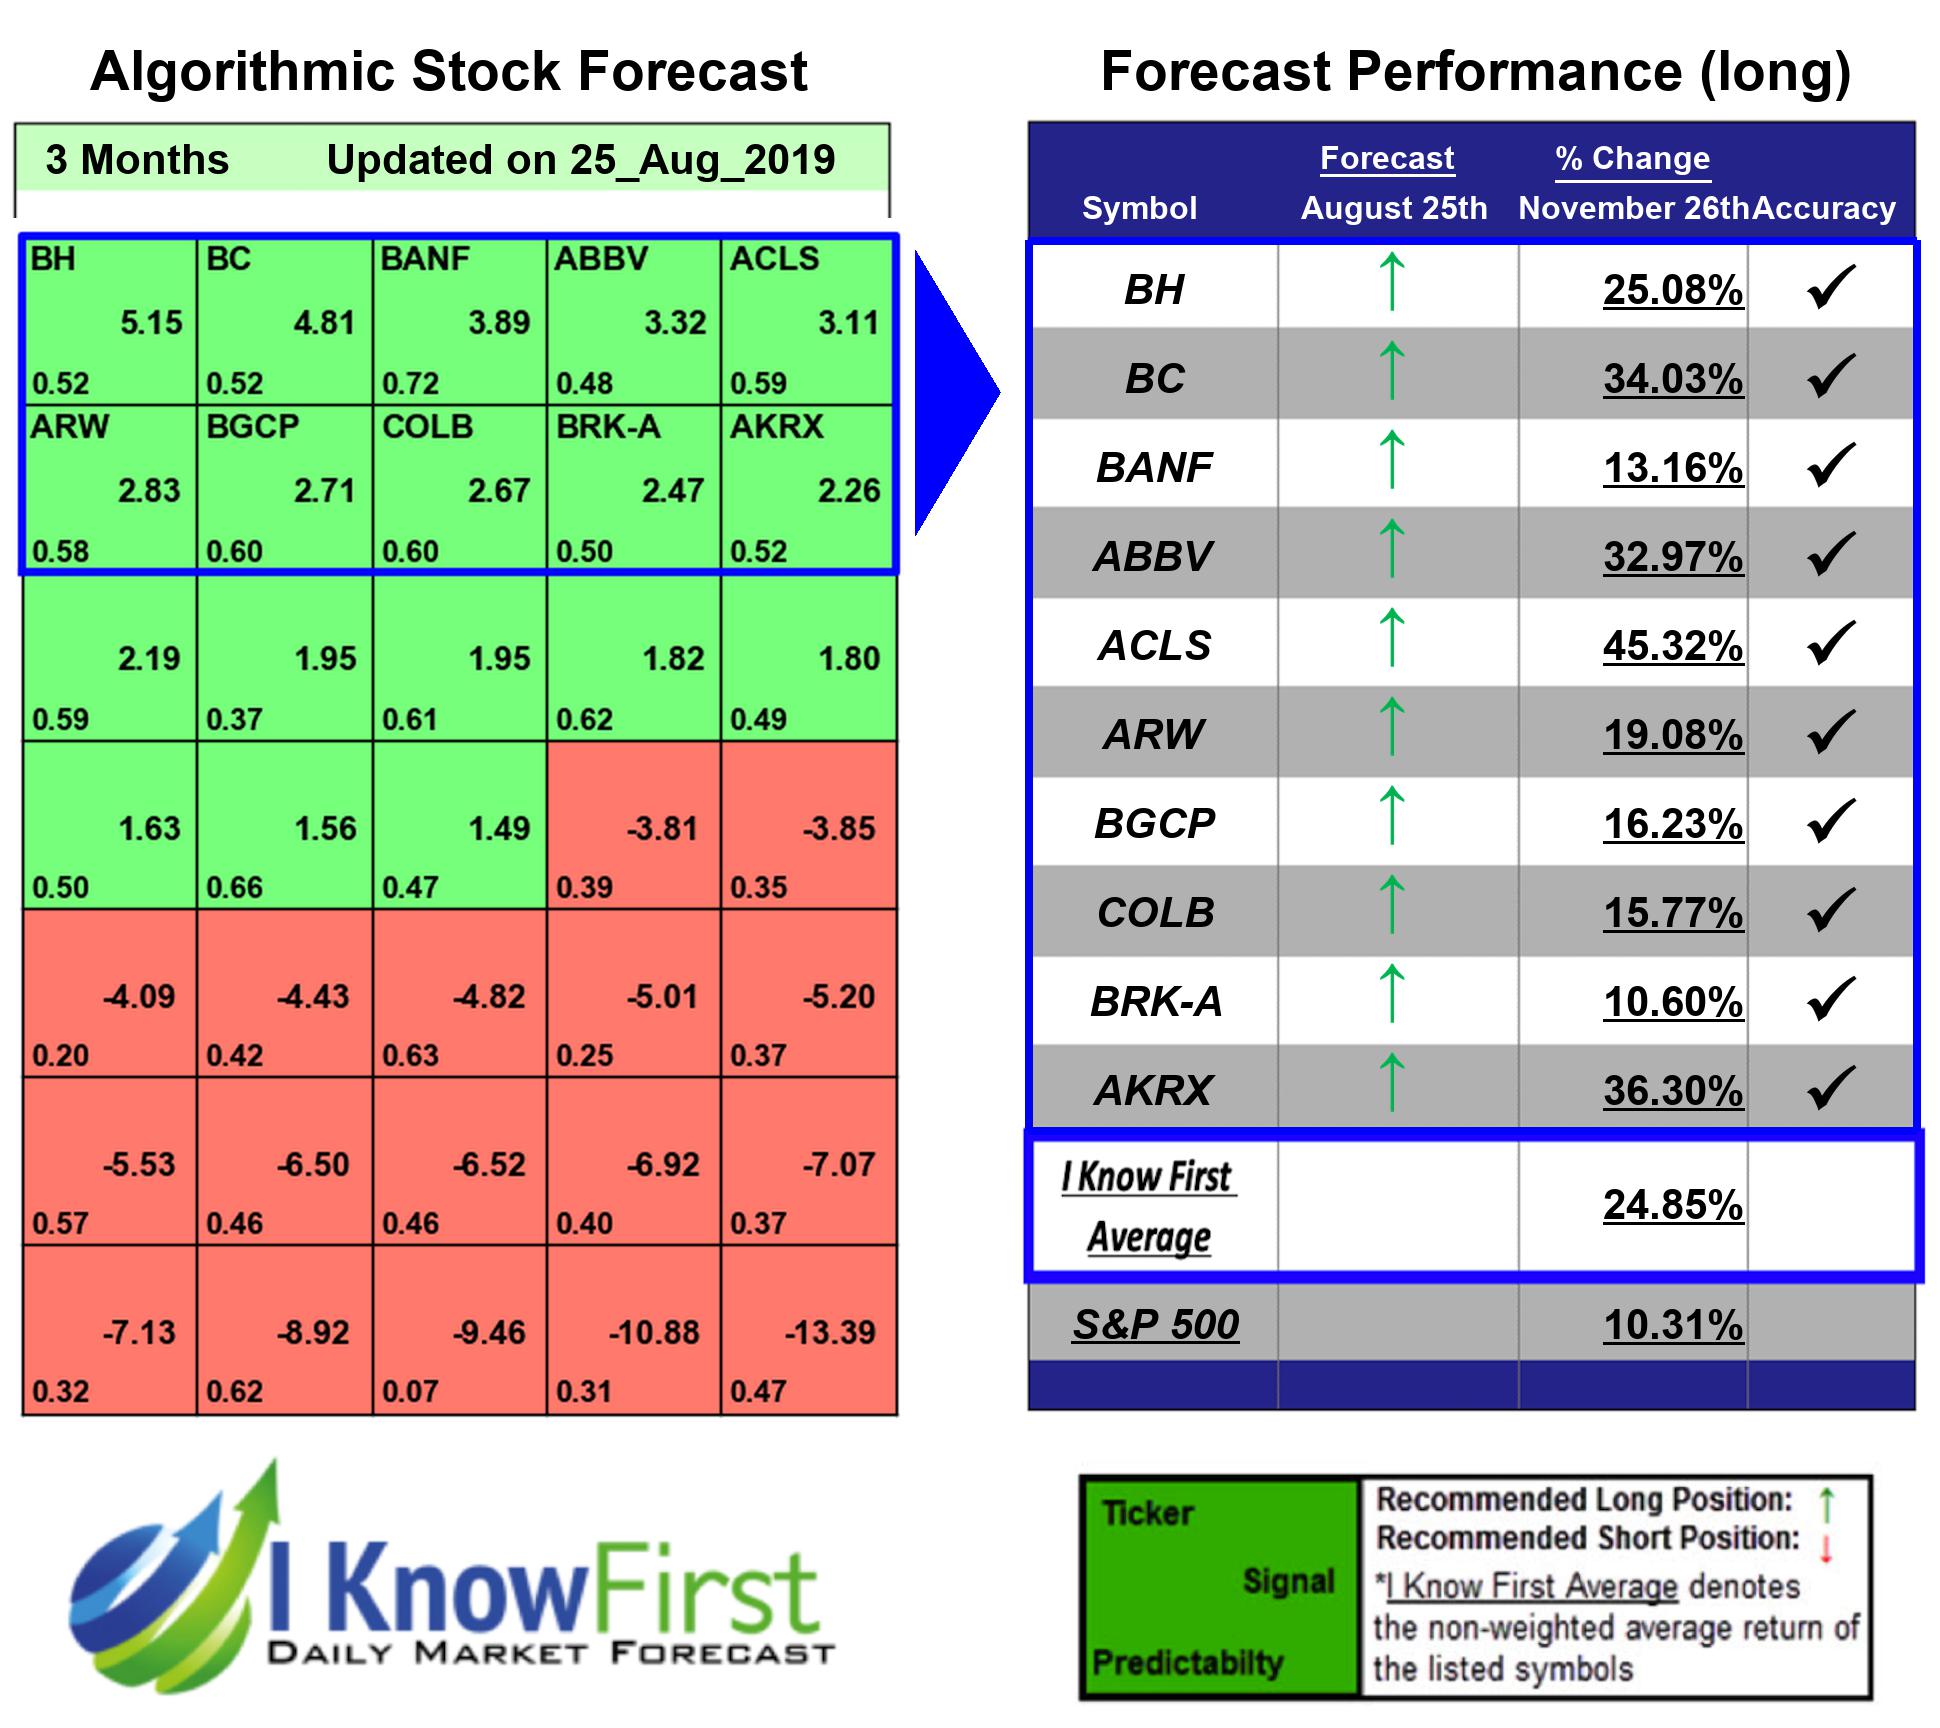
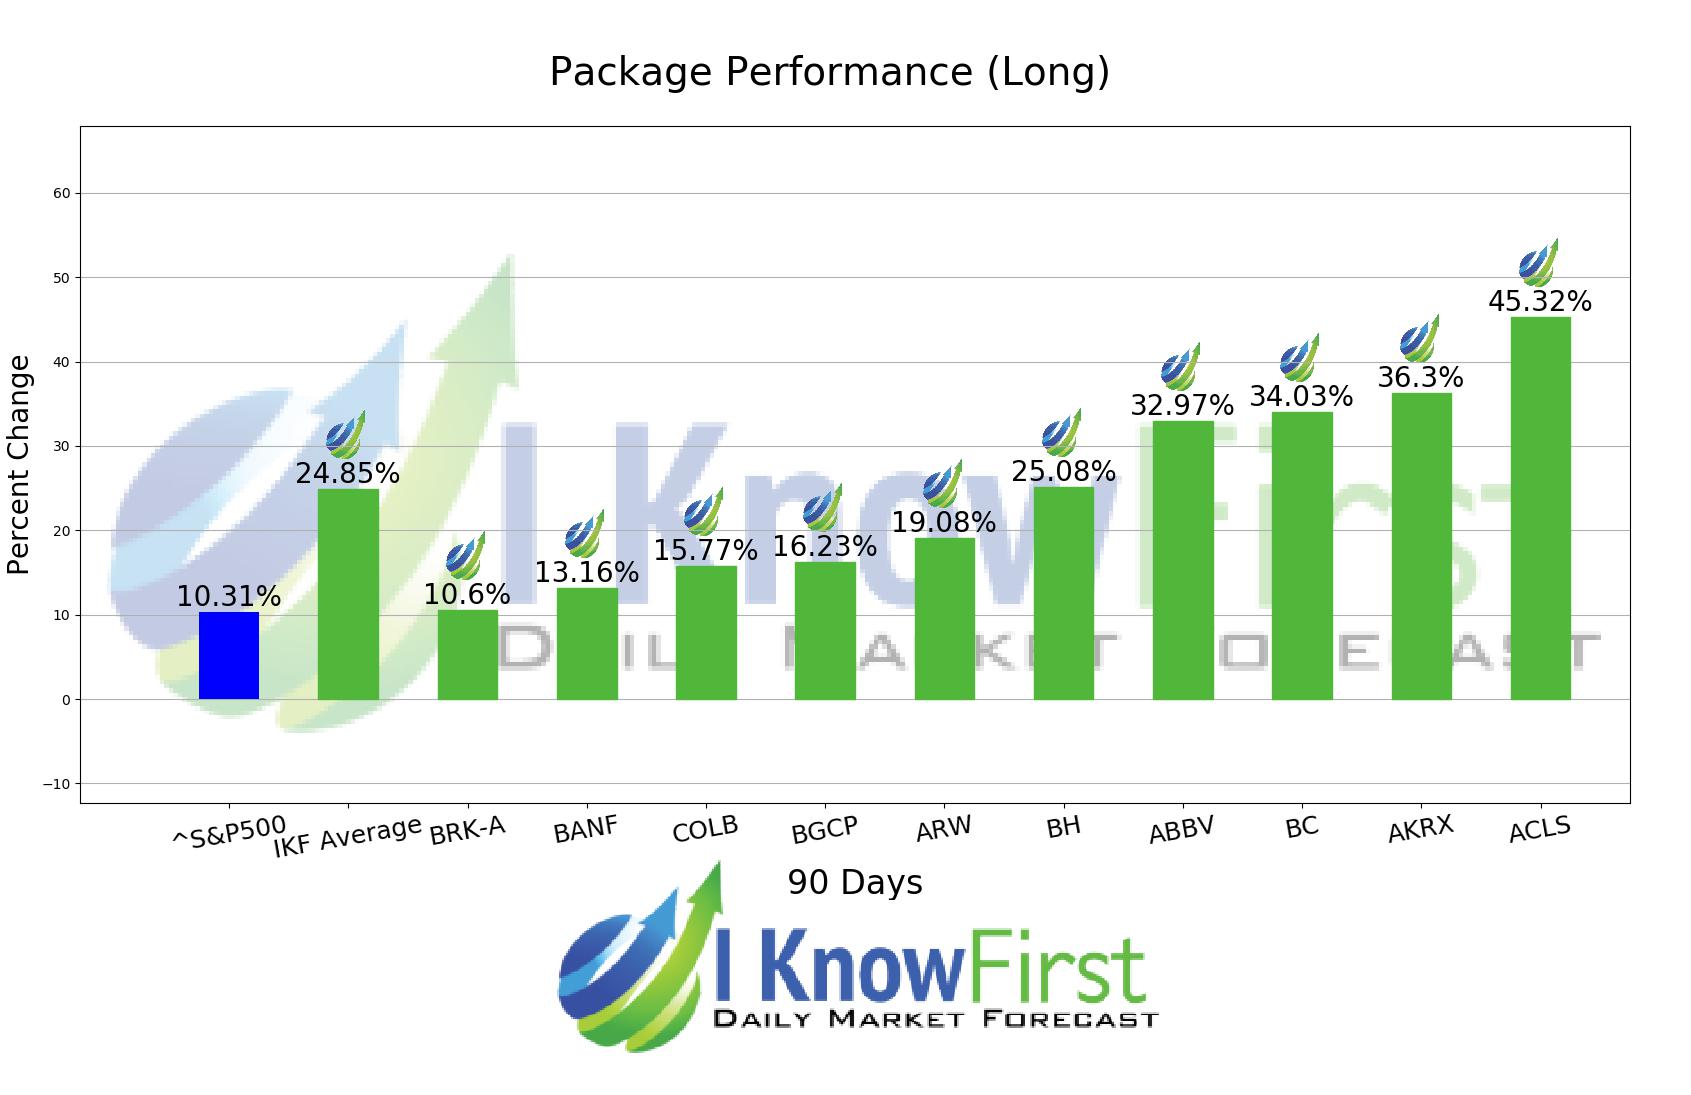
10 out of 10 stock prices in this forecast for the 52 Week Low Stocks Package moved as predicted by the algorithm. ACLS was the highest-earning trade with a return of 45.32% in 3 Months. AKRX and BC also performed well for this time horizon with returns of 36.3% and 34.03%, respectively. With these notable trade returns, the package itself registered an average return of 24.85% compared to the S&P 500’s return of 10.31% for the same period.
Axcelis Technologies, Inc. designs, manufactures, and services ion implantation and other processing equipment used in the fabrication of semiconductor chips in the United States, Europe, and the Asia Pacific.
Algorithmic traders utilize these daily forecasts by the I Know First market prediction system as a tool to enhance portfolio performance, verify their own analysis and act on market opportunities faster. This forecast was sent to current I Know First subscribers.
How to interpret this diagram
Algorithmic Stock Forecast: The table on the left is a stock forecast produced by I Know First’s algorithm. Each day, subscribers receive forecasts for six different time horizons. Note that the top 10 stocks in the 1-month forecast may be different than those in the 1-year forecast. In the included table, only the relevant stocks have been included. The boxes are arranged according to their respective signal and predictability values (see below for detailed definitions). A green box represents a positive forecast, suggesting a long position, while a red represents a negative forecast, suggesting a short position.
Please note-for trading decisions use the most recent forecast. Get today’s forecast and Top stock picks.


