
52 Week Low Stocks Based on Data Mining: Returns up to 35.79% in 7 Days
52 Week Low Stocks
The 52 Week Low Stocks Package is designed for investors and analysts who need predictions for stocks currently at their 52-week low price level, offering the best market opportunities based on algo-trading. It includes 20 stocks with bullish and bearish signals and indicates the best stocks to invest in:
- 52 Weeks Low Top 10 stocks for the long position
- 52 Weeks Low Top 10 stocks for the short position

Package Name: 52 Week Low Stocks
Recommended Positions: Long
Forecast Length: 7 Days (11/6/2020 – 11/14/2020)
I Know First Average: 12.29%
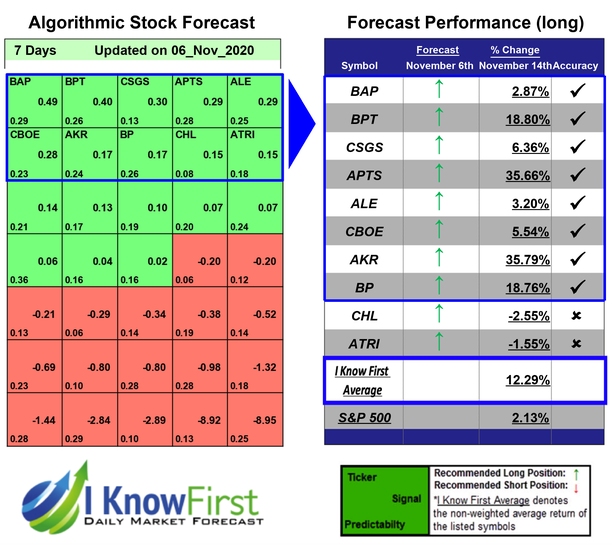

For this 7 Days forecast the algorithm had successfully predicted 8 out of 10 movements. The prediction with the highest return was AKR, at 35.79%. Further notable returns came from APTS and BPT at 35.66% and 18.8%, respectively. With these notable trade returns, the package itself registered an average return of 12.29% compared to the S&P 500’s return of 2.13% for the same period.
Acadia Realty Trust (AKR), a real estate investment trust (REIT), engages primarily in the ownership, acquisition, redevelopment, and management of retail properties in the United States. Its retail properties include neighborhood and community shopping centers, and mixed-use properties with retail components. As of December 31, 2008, it owned or had interests in, and operated 85 properties primarily in the northeast, mid-Atlantic, and Midwest regions of the United States. The company qualifies as a REIT for federal income tax purposes. As a REIT, it would not be subject to federal income tax to the extent that it distributes at least 90% of its taxable income to its shareholders. Acadia Realty Trust (AKR) was founded in 1964 and is headquartered in White Plains, New York.
Algorithmic traders utilize these daily forecasts by the I Know First market prediction system as a tool to enhance portfolio performance, verify their own analysis and act on market opportunities faster. This forecast was sent to current I Know First subscribers.
How to interpret this diagram
Algorithmic Stock Forecast: The table on the left is a stock forecast produced by I Know First’s algorithm. Each day, subscribers receive forecasts for six different time horizons. Note that the top 10 stocks in the 1-month forecast may be different than those in the 1-year forecast. In the included table, only the relevant stocks have been included. The boxes are arranged according to their respective signal and predictability values (see below for detailed definitions). A green box represents a positive forecast, suggesting a long position, while a red represents a negative forecast, suggesting a short position.
Please note-for trading decisions use the most recent forecast. Get today’s forecast and Top stock picks.


