
52 Week Low Stocks Based on Big Data: Returns up to 22.38% in 3 Days
52 Week Low Stocks
The 52 Week Low Stocks Package is designed for investors and analysts who need predictions for stocks currently at their 52-week low price level, offering the best market opportunities based on algo-trading. It includes 20 stocks with bullish and bearish signals and indicates the best stocks to invest in:
- 52 Weeks Low Top 10 stocks for the long position
- 52 Weeks Low Top 10 stocks for the short position

Package Name: 52 Week Low Stocks
Recommended Positions: Long
Forecast Length: 3 Days (12/6/2019 – 12/9/2019)
I Know First Average: 3.75%
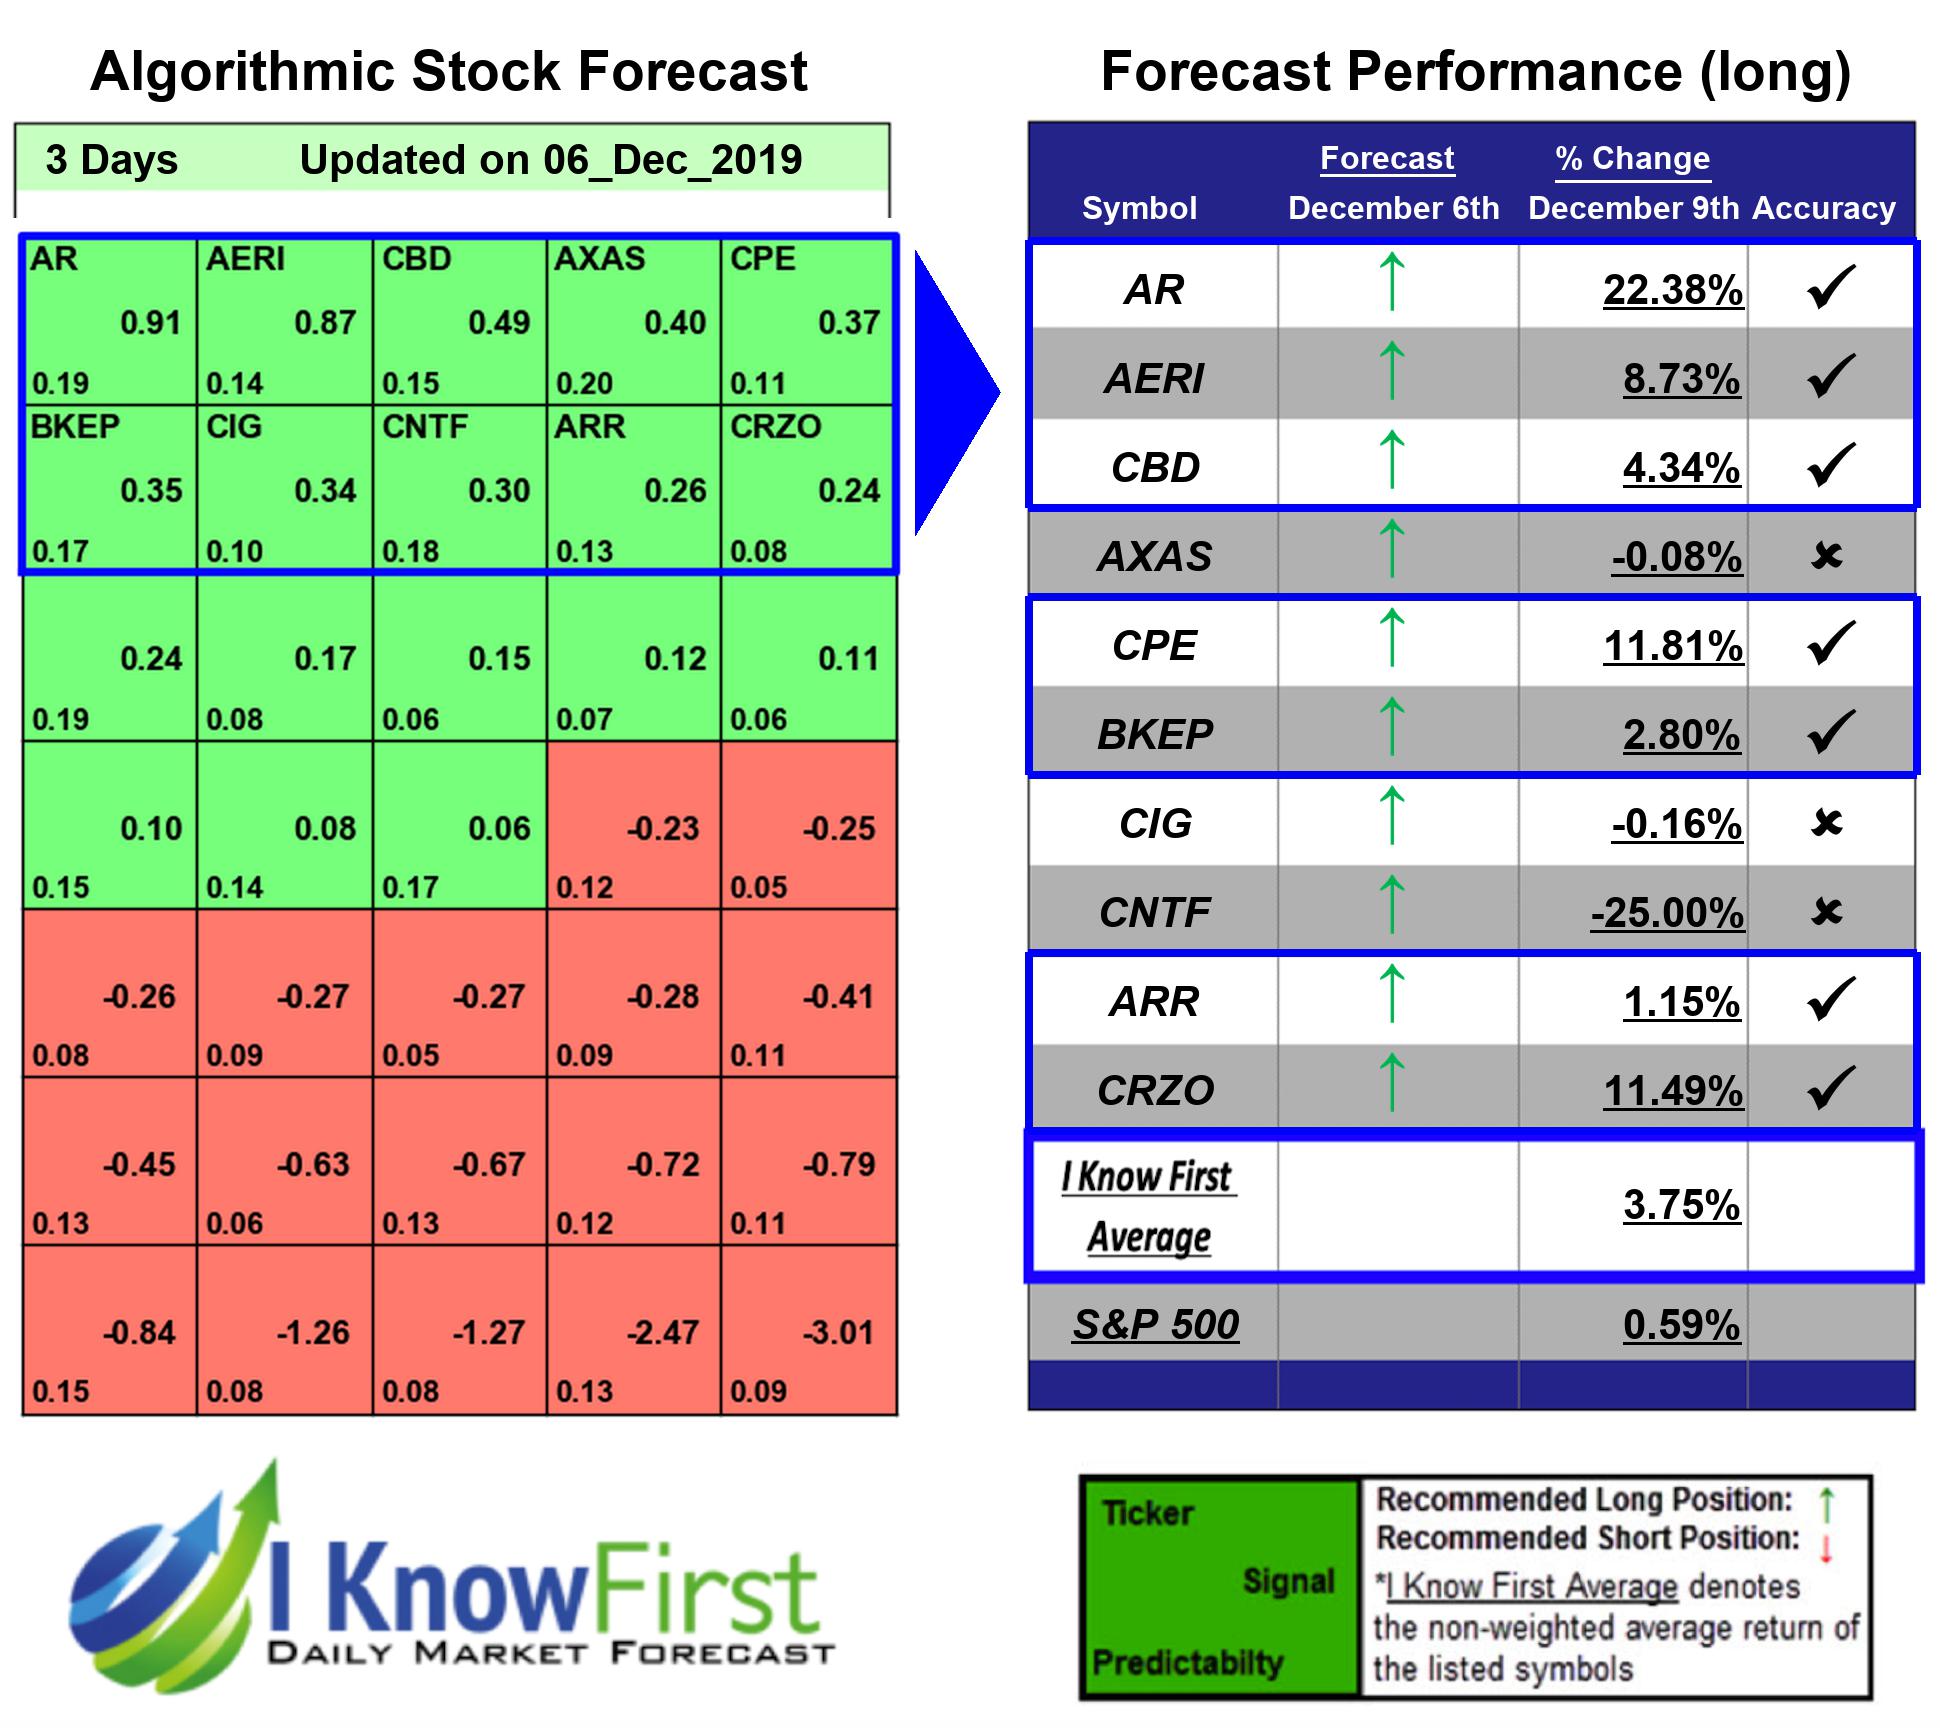
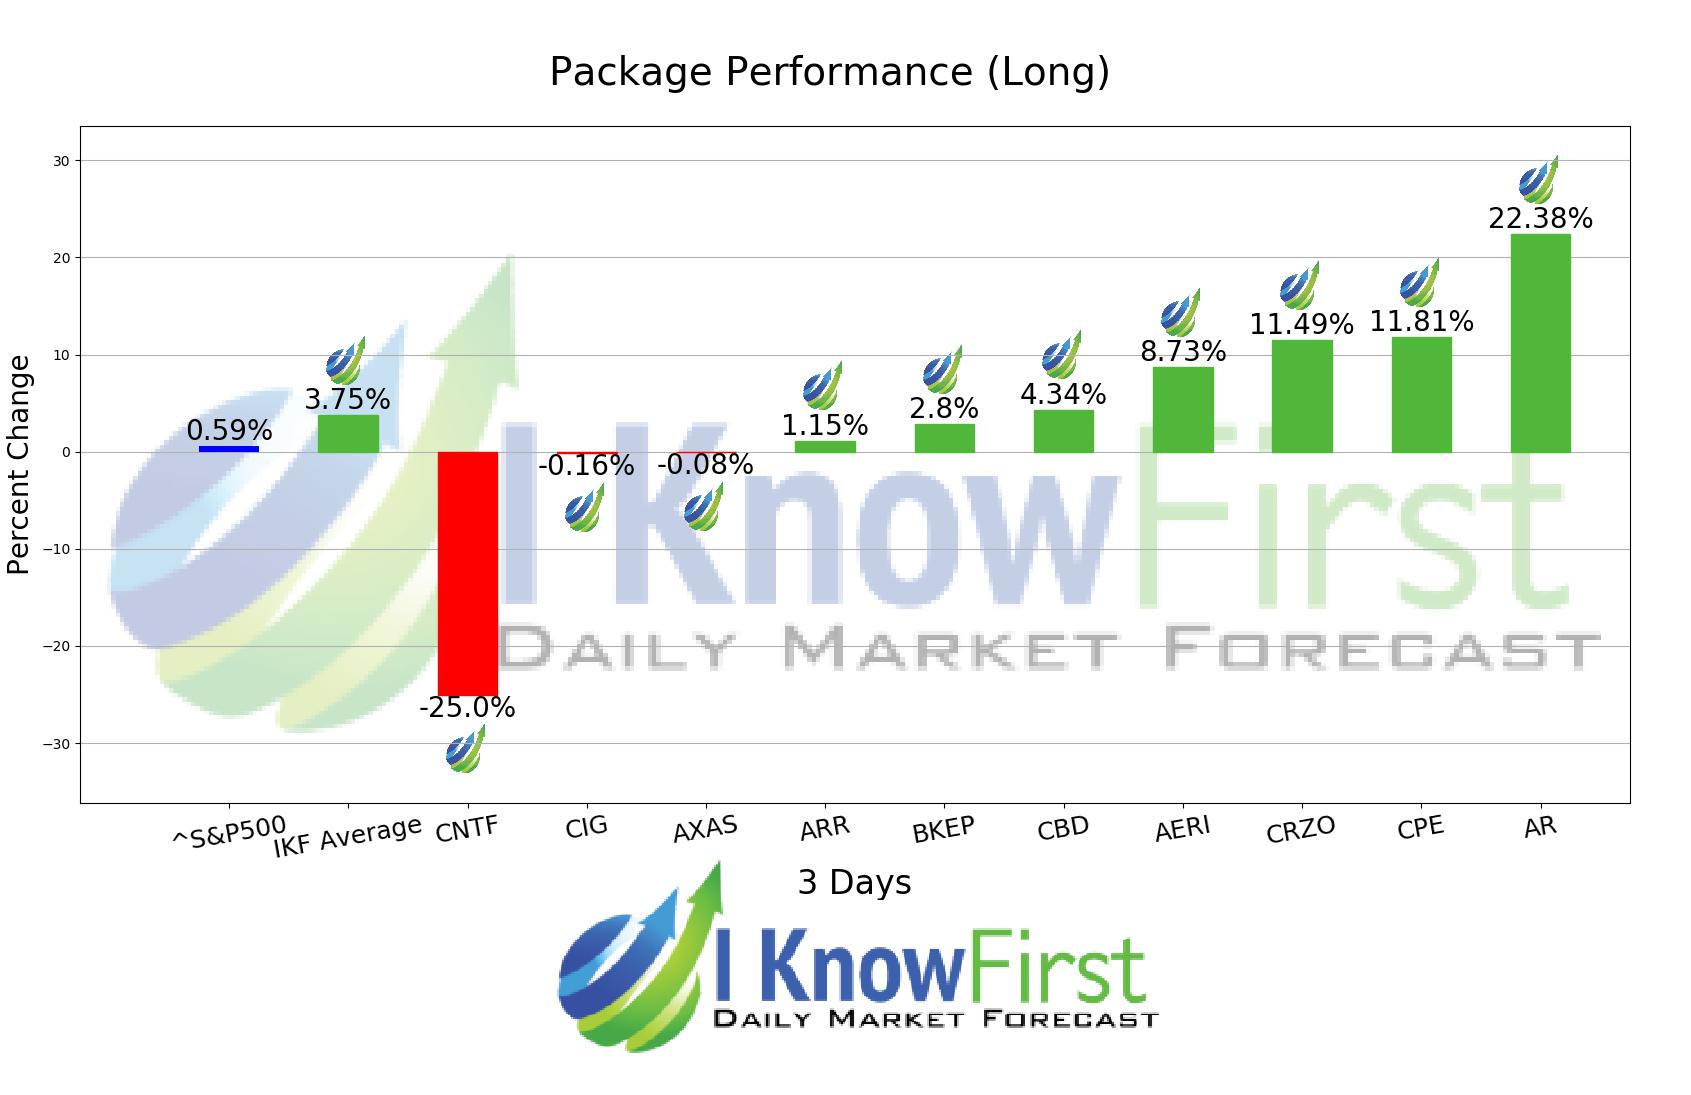
I Know First’s State of the Art Algorithm accurately forecasted 7 out of 10 trades in this 52 Week Low Stocks Package for the 3 Days time period. The prediction with the highest return was AR, at 22.38%. CPE and CRZO also performed well for this time horizon with returns of 11.81% and 11.49%, respectively. This algorithmic forecast package presented an overall return of 3.75% versus S&P 500’s performance of 0.59% providing a market premium of 3.16%.
Antero Resources Corporation (AR), an independent oil and natural gas company, acquires, explores, and develops natural gas, natural gas liquids, and oil properties in the United States. As of December 31, 2014, the company had 543,000 net acres of oil and gas properties located in the Appalachian Basin in West Virginia, Ohio, and Pennsylvania. It also owns and operates 153 miles of gas gathering pipelines in the Marcellus Shale; and 96 miles of low-pressure, high-pressure, and condensate pipelines in the Utica Shale. The company was formerly known as Antero Resources Appalachian Corporation and changed its name to Antero Resources Corporation (AR) in June 2013. Antero Resources Corporation (AR) was founded in 2002 and is headquartered in Denver, Colorado. Antero Resources Corporation operates as a subsidiary of Antero Resources Investment LLC.
Algorithmic traders utilize these daily forecasts by the I Know First market prediction system as a tool to enhance portfolio performance, verify their own analysis and act on market opportunities faster. This forecast was sent to current I Know First subscribers.
How to interpret this diagram
Algorithmic Stock Forecast: The table on the left is a stock forecast produced by I Know First’s algorithm. Each day, subscribers receive forecasts for six different time horizons. Note that the top 10 stocks in the 1-month forecast may be different than those in the 1-year forecast. In the included table, only the relevant stocks have been included. The boxes are arranged according to their respective signal and predictability values (see below for detailed definitions). A green box represents a positive forecast, suggesting a long position, while a red represents a negative forecast, suggesting a short position.
Please note-for trading decisions use the most recent forecast. Get today’s forecast and Top stock picks.


