
52 Week Low Stocks Based on Artificial Intelligence: Returns up to 64.03% in 1 Year
52 Week Low Stocks
The 52 Week Low Stocks Package is designed for investors and analysts who need predictions for stocks currently at their 52-week low price level, offering the best market opportunities based on algo-trading. It includes 40 stocks with bullish and bearish signals and indicates the best stocks to invest in:
- 52 Weeks Low Top 20 stocks for the long position
- 52 Weeks Low Top 20 stocks for the short position

Package Name: 52 Week Low Stocks
Recommended Positions: Long
Forecast Length: 1 Year (9/9/2018 – 9/10/2019)
I Know First Average: 7.35%

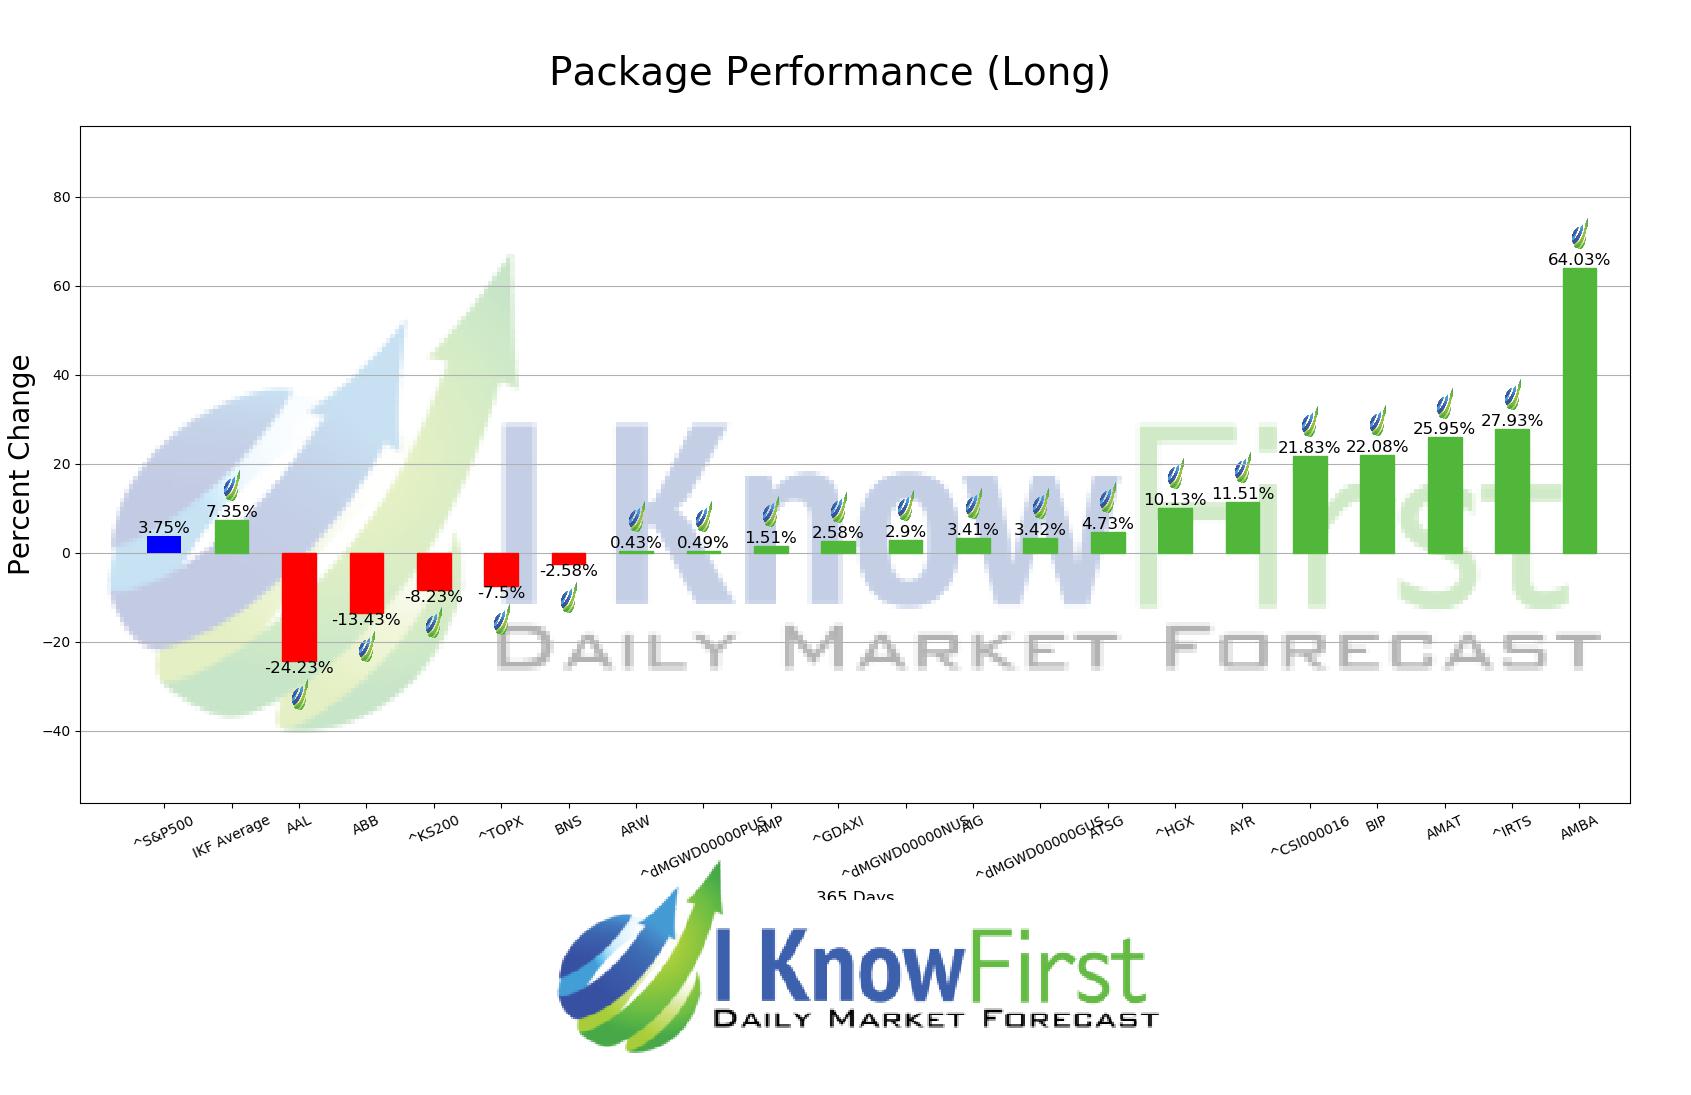
The algorithm correctly predicted 15 out 20 of the suggested trades in the 52 Week Low Stocks Package for this 1 Year forecast. The highest trade return came from AMBA, at 64.03%. ^IRTS and AMAT saw outstanding returns of 27.93% and 25.95%. The overall average return in this 52 Week Low Stocks package was 7.35%, providing investors with a 3.60% premium over the S&P 500’s return of 3.75% during the same period.
Ambarella, Inc., incorporated on January 15, 2004, is a developer of semiconductor processing solutions for video that enable high-definition (HD), video capture, sharing and display. The Company operates through the development and sales of low-power, high-definition video products segment. The Company’s system-on-a-chip (SoC) designs incorporate HD video processing, image processing, audio processing and system functions onto a single chip. In the camera market, its platform enables the creation of video content in wearable cameras, automotive aftermarket cameras, professional and consumer Internet Protocol (IP), security cameras, telepresence cameras and unmanned aerial vehicles (UAVs). In the infrastructure market, the Company’s solutions manage IP video traffic, broadcast encoding and transcoding, and IP video delivery applications.
Algorithmic traders utilize these daily forecasts by the I Know First market prediction system as a tool to enhance portfolio performance, verify their own analysis and act on market opportunities faster. This forecast was sent to current I Know First subscribers.
How to interpret this diagram
Algorithmic Stock Forecast: The table on the left is a stock forecast produced by I Know First’s algorithm. Each day, subscribers receive forecasts for six different time horizons. Note that the top 20 stocks in the 1-month forecast may be different than those in the 1-year forecast. In the included table, only the relevant stocks have been included. The boxes are arranged according to their respective signal and predictability values (see below for detailed definitions). A green box represents a positive forecast, suggesting a long position, while a red represents a negative forecast, suggesting a short position.
Please note-for trading decisions use the most recent forecast. Get today’s forecast and Top stock picks.


