
52 Week Low Stocks Based on Artificial Intelligence: Returns up to 44.53% in 3 Days
52 Week Low Stocks
The 52 Week Low Stocks Package is designed for investors and analysts who need predictions for stocks currently at their 52-week low price level, offering the best market opportunities based on algo-trading. It includes 20 stocks with bullish and bearish signals and indicates the best stocks to invest in:
- 52 Weeks Low Top 10 stocks for the long position
- 52 Weeks Low Top 10 stocks for the short position

Package Name: 52 Week Low Stocks
Recommended Positions: Long
Forecast Length: 3 Days (11/8/2020 – 11/11/2020)
I Know First Average: 11.04%
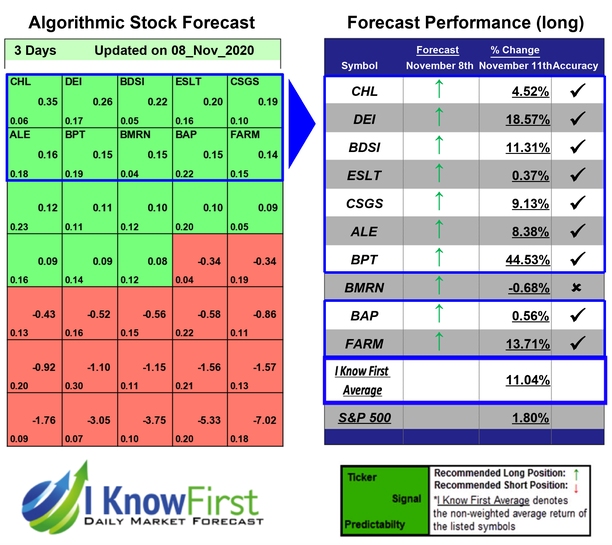

During the 3 Days forecasted period several picks in the 52 Week Low Stocks Package saw significant returns. The algorithm had correctly predicted 9 out 10 returns. BPT was the highest-earning trade with a return of 44.53% in 3 Days. Additional high returns came from DEI and FARM, at 18.57% and 13.71% respectively. The 52 Week Low Stocks package had an overall average return of 11.04%, providing investors with a premium of 9.24% over the S&P 500’s return of 1.8%.
BP Prudhoe Bay Royalty Trust (BPT) operates as a grantor trust in the United States. The company holds overriding royalty interest comprising a non-operational interest in minerals in the Prudhoe Bay oil field located on the North Slope of Alaska. The Prudhoe Bay field extends approximately 12 miles by 27 miles and contains approximately 150,000 gross productive acres. As of December 31, 2015, its estimated net remaining proved reserves were 23.052 million barrels of oil and condensate, of which 22.418 million barrels are proved developed reserves and 0.634 million barrels are proved undeveloped reserves. BP Prudhoe Bay Royalty Trust (BPT) was founded in 1989 and is based in Houston, Texas.
Algorithmic traders utilize these daily forecasts by the I Know First market prediction system as a tool to enhance portfolio performance, verify their own analysis and act on market opportunities faster. This forecast was sent to current I Know First subscribers.
How to interpret this diagram
Algorithmic Stock Forecast: The table on the left is a stock forecast produced by I Know First’s algorithm. Each day, subscribers receive forecasts for six different time horizons. Note that the top 10 stocks in the 1-month forecast may be different than those in the 1-year forecast. In the included table, only the relevant stocks have been included. The boxes are arranged according to their respective signal and predictability values (see below for detailed definitions). A green box represents a positive forecast, suggesting a long position, while a red represents a negative forecast, suggesting a short position.
Please note-for trading decisions use the most recent forecast. Get today’s forecast and Top stock picks.


