
52 Week Low Stocks Based on Algorithmic Trading: Returns up to 162.83% in 1 Year
52 Week Low Stocks
The 52 Week Low Stocks Package is designed for investors and analysts who need predictions for stocks currently at their 52-week low price level, offering the best market opportunities based on algo-trading. It includes 20 stocks with bullish and bearish signals and indicates the best stocks to invest in:
- 52 Weeks Low Top 10 stocks for the long position
- 52 Weeks Low Top 10 stocks for the short position

Package Name: 52 Week Low Stocks
Recommended Positions: Long
Forecast Length: 1 Year (1/9/2019 – 1/9/2020)
I Know First Average: 64.21%
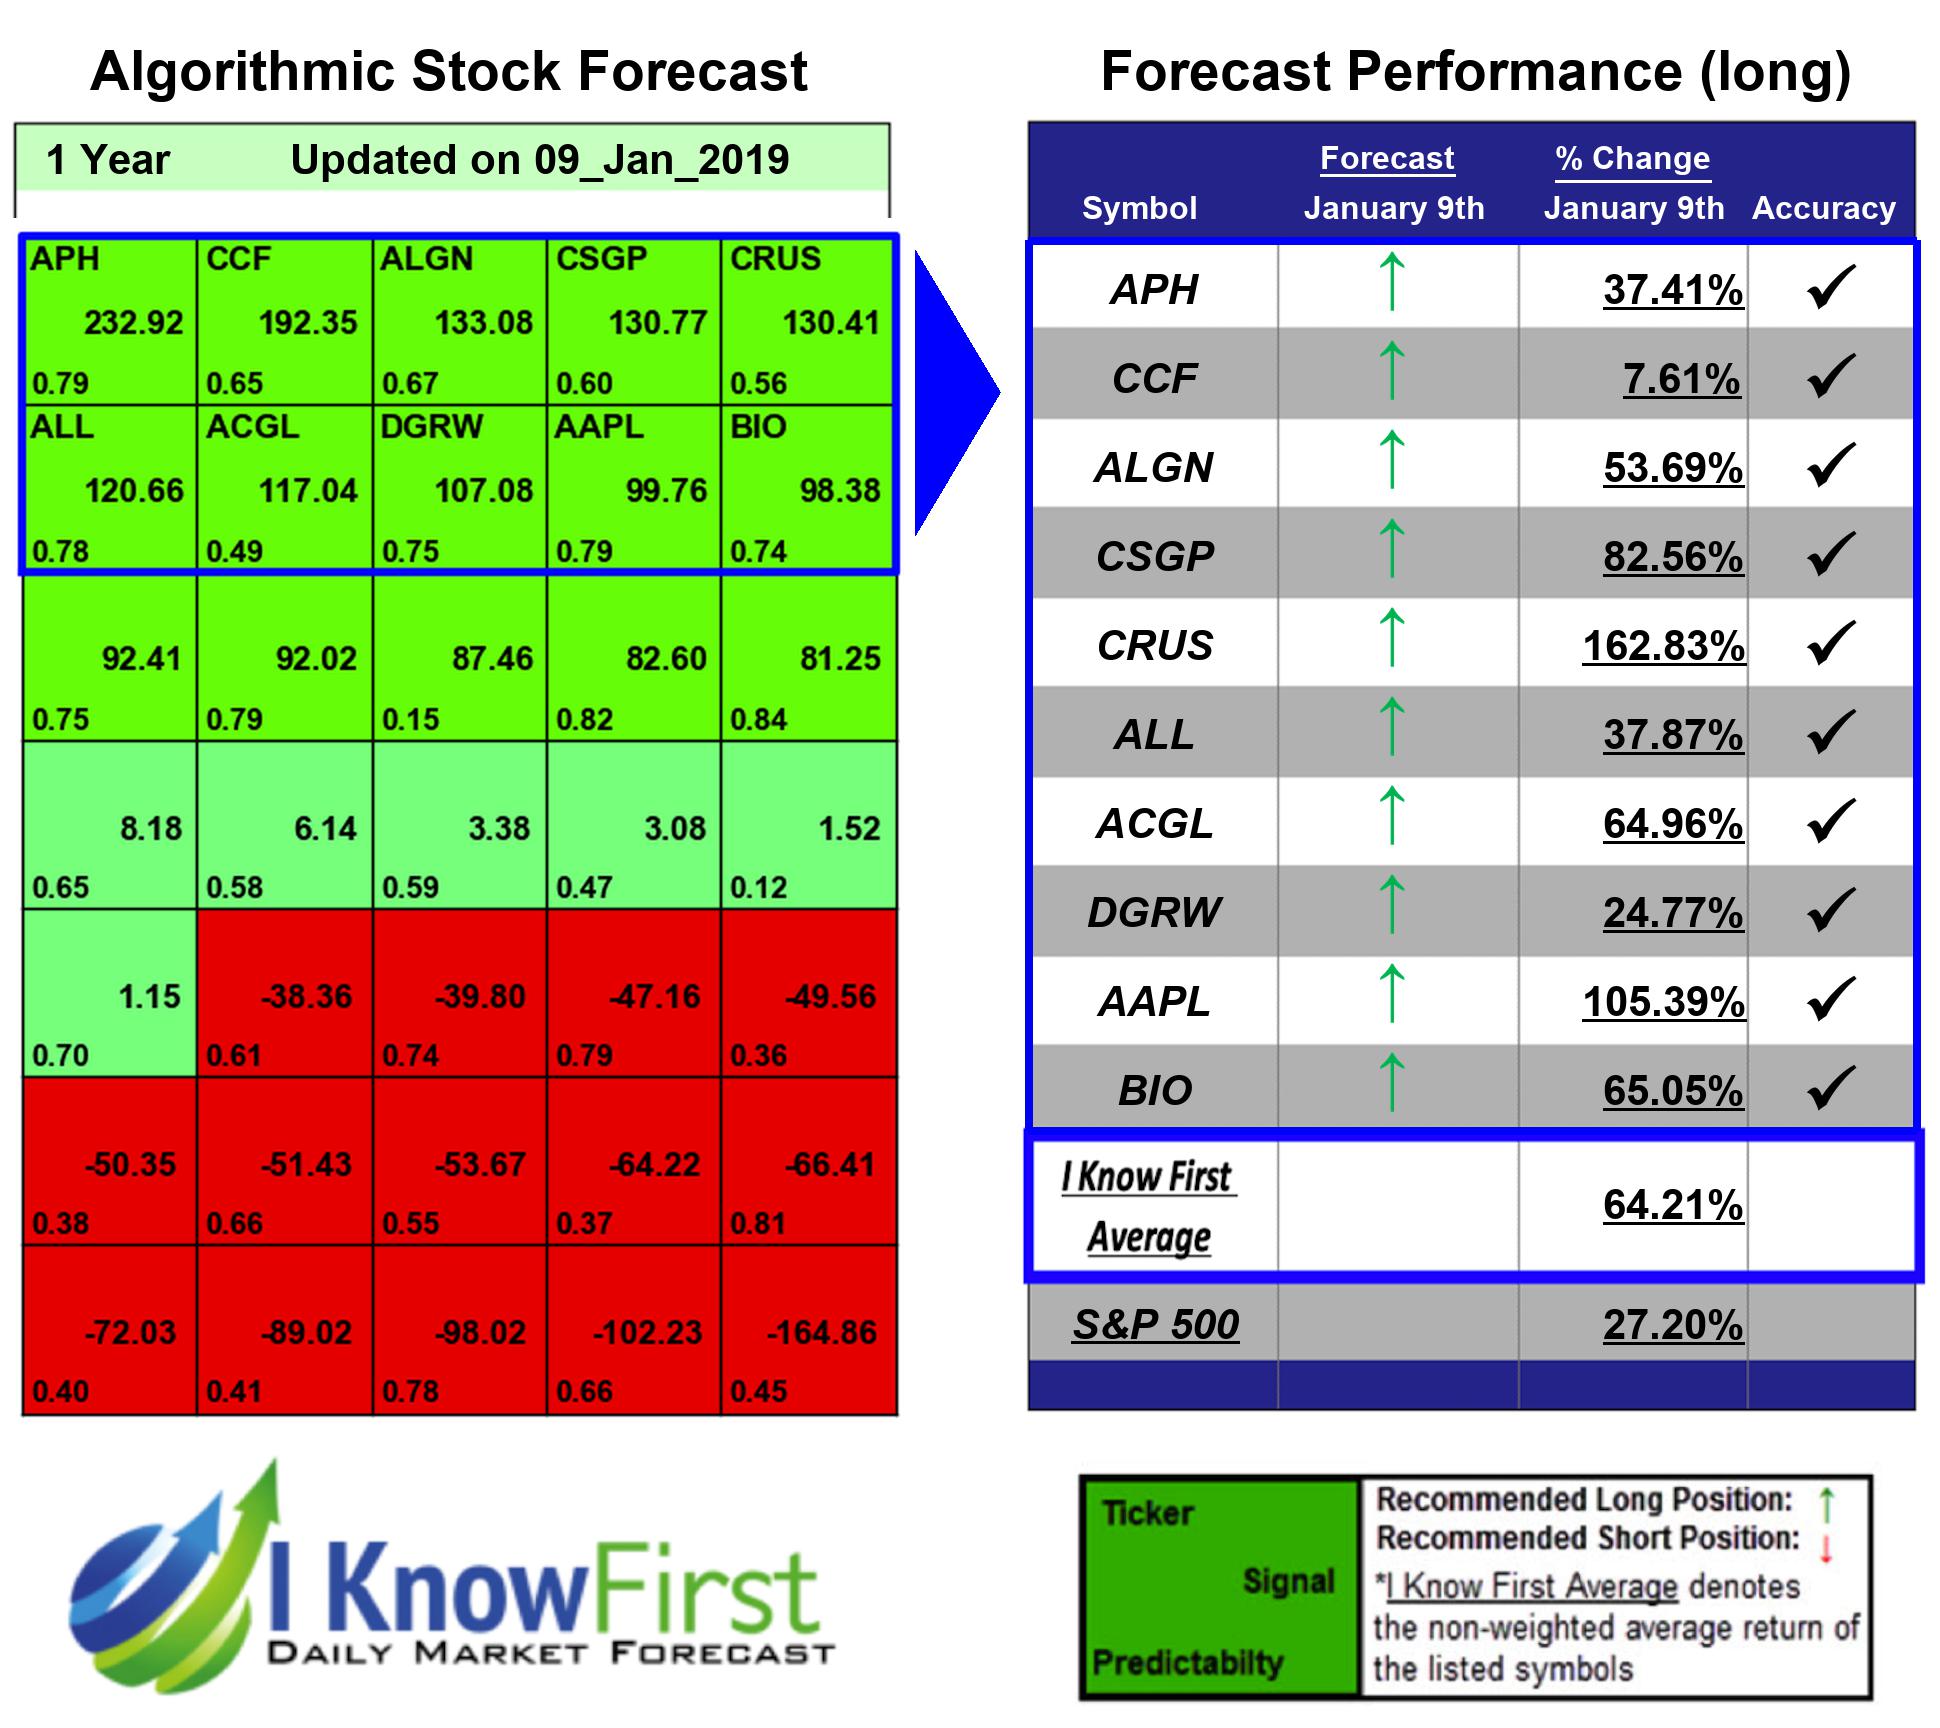

In this 1 Year forecast for the 52 Week Low Stocks Package, there were many high performing trades and the algorithm correctly predicted 10 out 10 trades. The top-performing prediction in this forecast was CRUS, which registered a return of 162.83%. Other notable stocks were AAPL and CSGP with a return of 105.39% and 82.56%. The 52 Week Low Stocks package had an overall average return of 64.21%, providing investors with a premium of 37.01% over the S&P 500’s return of 27.2%.
Cirrus Logic Inc. (CRUS) is located in Austin, Texas since 2015 where they still have their headquarters. They are the suppliers of fabless semiconductor that specializes in analog, mixed-signal, and audioDSP integrated circuits.
Algorithmic traders utilize these daily forecasts by the I Know First market prediction system as a tool to enhance portfolio performance, verify their own analysis and act on market opportunities faster. This forecast was sent to current I Know First subscribers.
How to interpret this diagram
Algorithmic Stock Forecast: The table on the left is a stock forecast produced by I Know First’s algorithm. Each day, subscribers receive forecasts for six different time horizons. Note that the top 10 stocks in the 1-month forecast may be different than those in the 1-year forecast. In the included table, only the relevant stocks have been included. The boxes are arranged according to their respective signal and predictability values (see below for detailed definitions). A green box represents a positive forecast, suggesting a long position, while a red represents a negative forecast, suggesting a short position.
Please note-for trading decisions use the most recent forecast. Get today’s forecast and Top stock picks.


