
52 Week High Stocks Based on Machine Learning: Returns up to 412.45% in 1 Year
52 Week High Stocks
The 52 Week High Stocks Package is designed for investors and analysts who need predictions for stocks currently at their 52-week high price level. It includes 20 stocks with bullish and bearish signals and indicates the best shares to buy and sell:
- 52 Weeks High Top 10 stocks for the long position
- 52 Weeks High Top 10 stocks for the short position
![]()
![]()
Package Name: 52 Week High Stocks
Recommended Positions: Long
Forecast Length: 1 Year (11/22/20 – 11/23/21)
I Know First Average: 69.67%
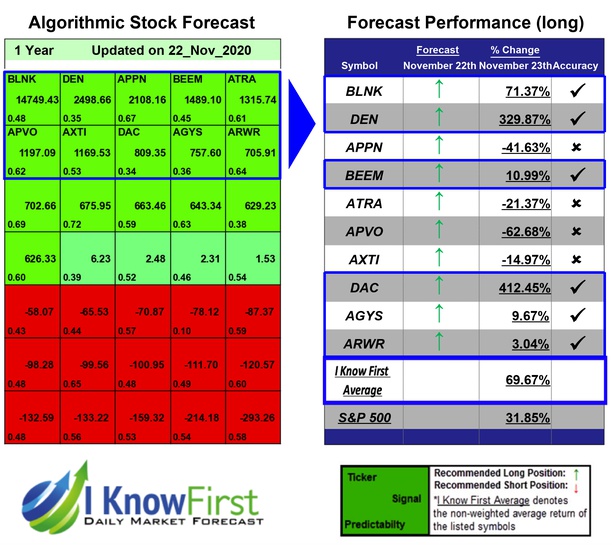
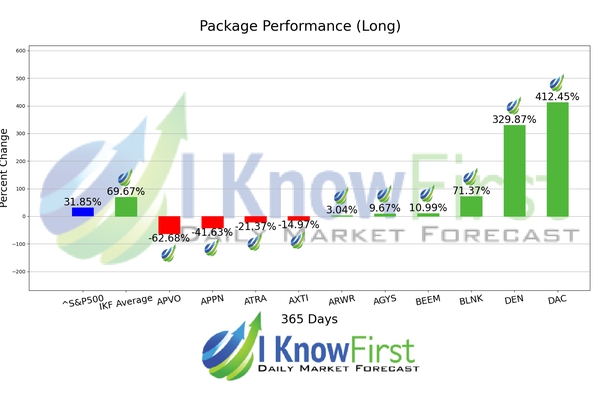
This 52 Week High Stocks Package forecast had correctly predicted 6 out of 10 stock movements. The top-performing prediction in this forecast was DAC, which registered a return of 412.45%. Other notable stocks were DEN and BLNK with a return of 329.87% and 71.37%. The overall average return in this 52 Week High Stocks package was 69.67%, providing investors with a 37.82% premium over the S&P 500’s return of 31.85% during the same period.
Danaos Corporation (DAC), together with its subsidiaries, owns and operates containerships in Greece and internationally. The company offers seaborne transportation services, as well as charters its vessels to liner companies. As of March 18, 2016, it had a fleet of 59 containerships aggregating 353,586 twenty foot equivalent units. The company was formerly known as Danaos Holdings Limited and changed its name to Danaos Corporation (DAC) in October 2005. Danaos Corporation (DAC) was founded in 1972 and is based in Piraeus, Greece.
Algorithmic traders utilize these daily forecasts by the I Know First market prediction system as a tool to enhance portfolio performance, verify their own analysis and act on market opportunities faster. This forecast was sent to current I Know First subscribers.
How to interpret this diagram
Algorithmic Stock Forecast: The table on the left is a stock forecast produced by I Know First’s algorithm. Each day, subscribers receive forecasts for six different time horizons. Note that the top 10 stocks in the 1-month forecast may be different than those in the 1-year forecast. In the included table, only the relevant stocks have been included. The boxes are arranged according to their respective signal and predictability values (see below for detailed definitions). A green box represents a positive forecast, suggesting a long position, while a red represents a negative forecast, suggesting a short position.
Please note-for trading decisions use the most recent forecast. Get today’s forecast and Top stock picks.


