
52 Week High Stocks Based on Deep Learning: Returns up to 13.53% in 7 Days
52 Week High Stocks
The 52 Week High Stocks Package is designed for investors and analysts who need predictions for stocks currently at their 52-week high price level. It includes 20 stocks with bullish and bearish signals and indicates the best shares to buy and sell:
- 52 Weeks High Top 10 stocks for the long position
- 52 Weeks High Top 10 stocks for the short position
![]()
![]()
Package Name: 52 Week High Stocks
Recommended Positions: Long
Forecast Length: 7 Days (10/6/21 – 10/13/21)
I Know First Average: 1.77%
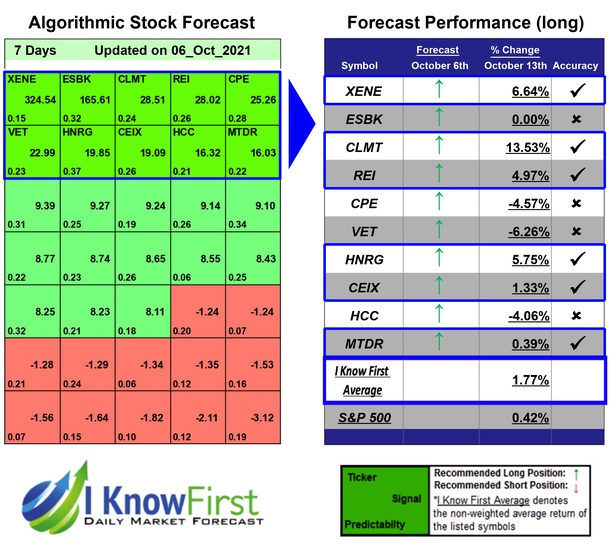

For this 7 Days forecast the algorithm had successfully predicted 6 out of 10 movements. The top performing prediction from this package was CLMT with a return of 13.53%. Further notable returns came from XENE and HNRG at 6.64% and 5.75%, respectively. The package’s overall average return was 1.77%, providing investors with a 1.35% premium over the S&P 500’s return of 0.42% during the same period.
Calumet Specialty Products Partners, L.P. produces and sells specialty hydrocarbon products in North America. It operates in three segments: Specialty Products, Fuel Products, and Oilfield Services.
Algorithmic traders utilize these daily forecasts by the I Know First market prediction system as a tool to enhance portfolio performance, verify their own analysis and act on market opportunities faster. This forecast was sent to current I Know First subscribers.
How to interpret this diagram
Algorithmic Stock Forecast: The table on the left is a stock forecast produced by I Know First’s algorithm. Each day, subscribers receive forecasts for six different time horizons. Note that the top 10 stocks in the 1-month forecast may be different than those in the 1-year forecast. In the included table, only the relevant stocks have been included. The boxes are arranged according to their respective signal and predictability values (see below for detailed definitions). A green box represents a positive forecast, suggesting a long position, while a red represents a negative forecast, suggesting a short position.
Please note-for trading decisions use the most recent forecast. Get today’s forecast and Top stock picks.


