
52 Week High Stocks Based on Data Mining: Returns up to 109.61% in 1 Year
52 Week High Stocks
The 52 Week High Stocks Package is designed for investors and analysts who need predictions for stocks currently at their 52-week high price level. It includes 20 stocks with bullish and bearish signals and indicates the best shares to buy and sell:
- 52 Weeks High Top 10 stocks for the long position
- 52 Weeks High Top 10 stocks for the short position
![]()
![]()
Package Name: 52 Week High Stocks
Recommended Positions: Long
Forecast Length: 1 Year (5/19/2019 – 5/20/2020)
I Know First Average: 16.1%
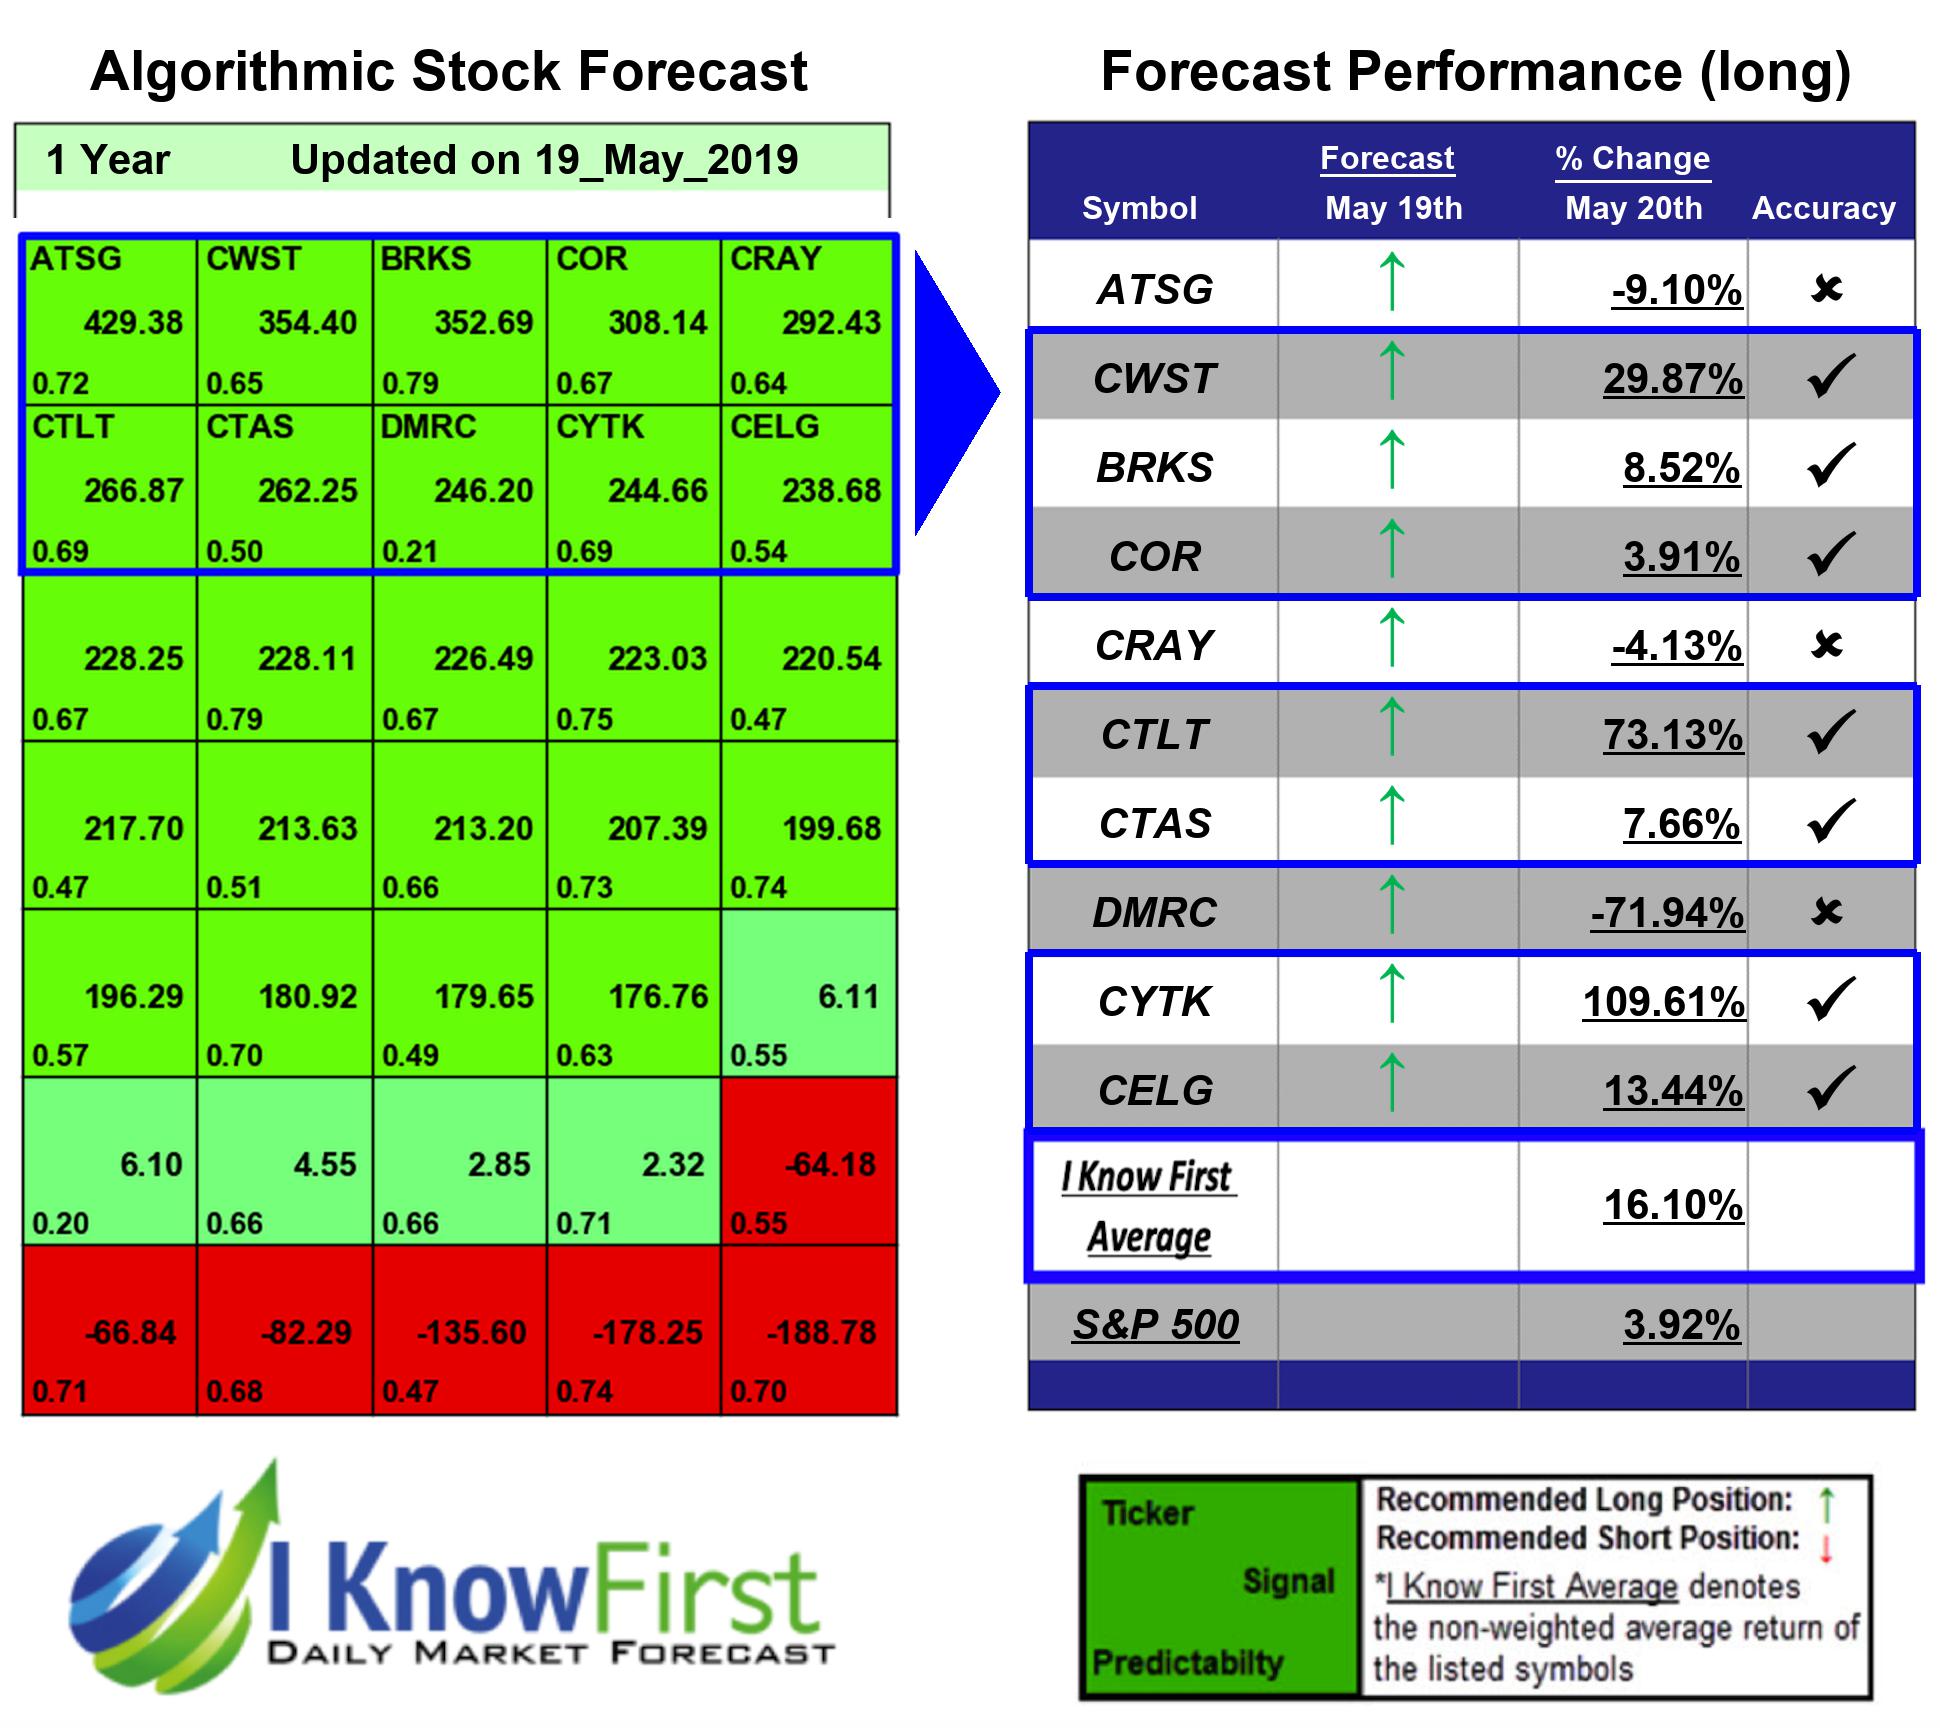
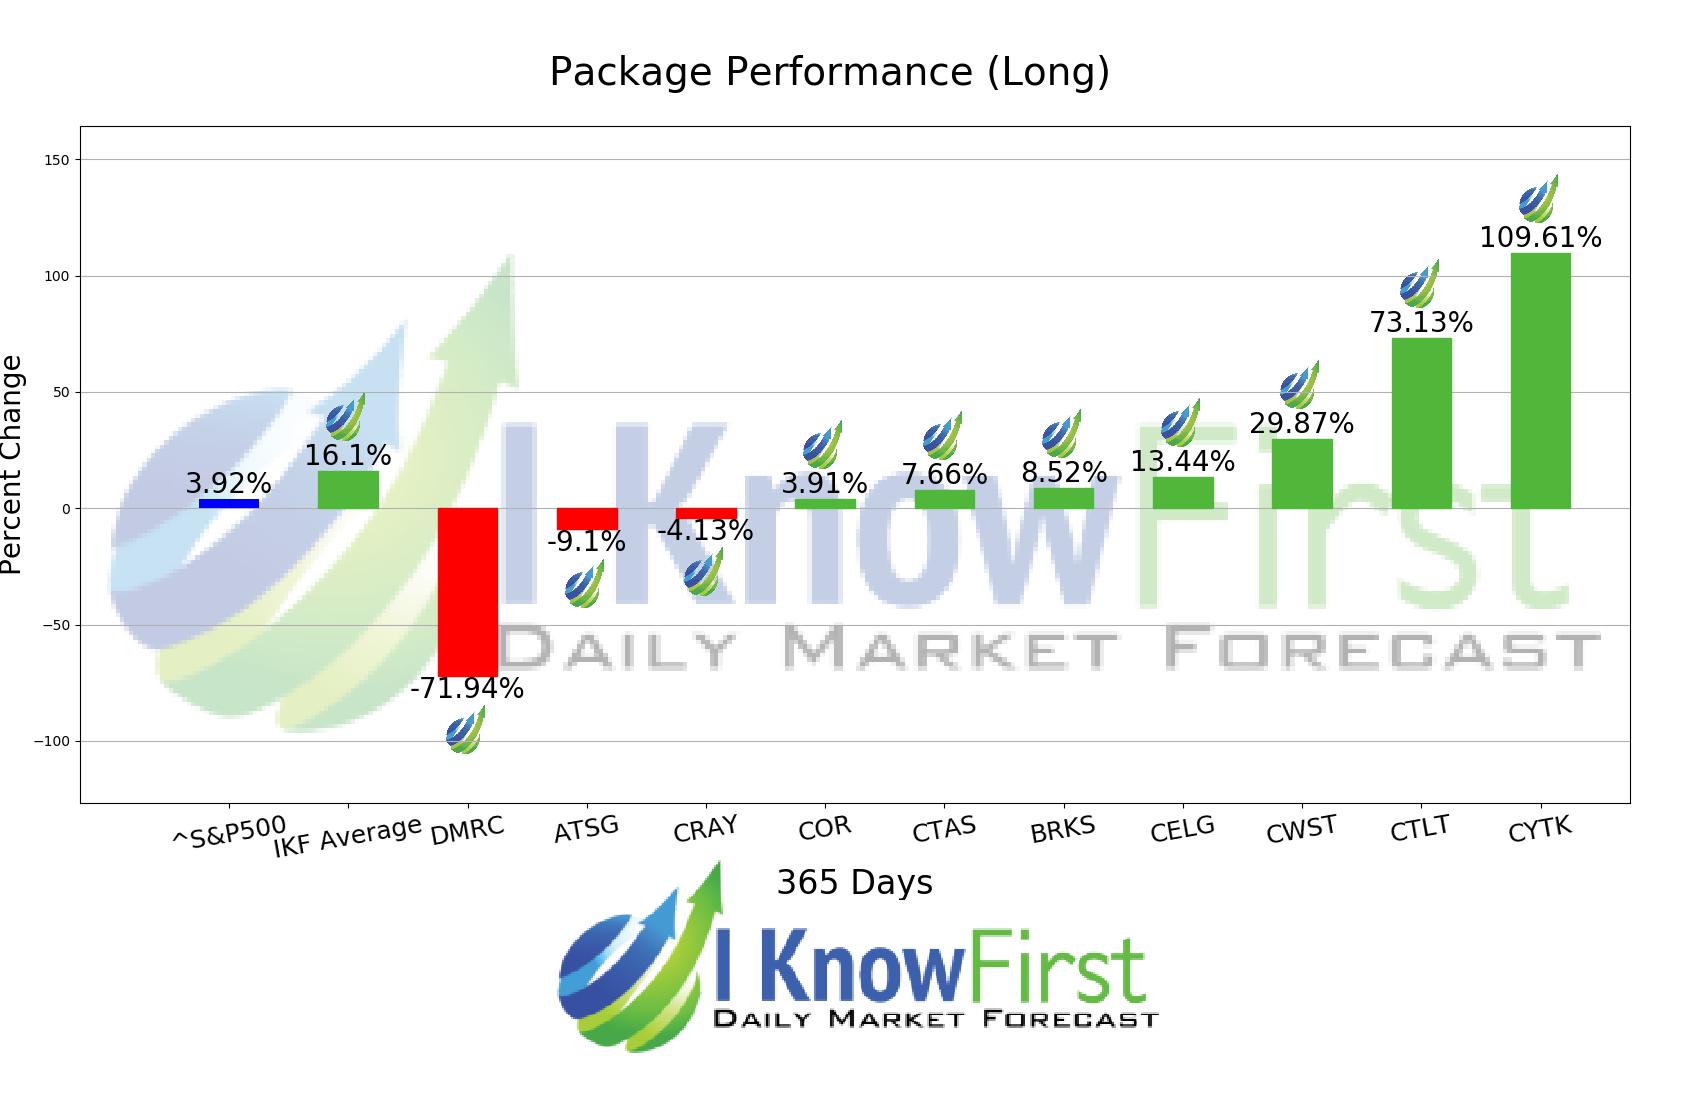
I Know First’s State of the Art Algorithm accurately forecasted 7 out of 10 trades in this 52 Week High Stocks Package for the 1 Year time period. CYTK was the top performing prediction with a return of 109.61%. CTLT and CWST saw outstanding returns of 73.13% and 29.87%. The overall average return in this 52 Week High Stocks package was 16.1%, providing investors with a 12.18% premium over the S&P 500’s return of 3.92% during the same period.
Cytokinetics, Incorporated, incorporated on August 5, 1997, is a late-stage biopharmaceutical company. The Company is focused on discovering, developing and commercializing first-in-class muscle activators as potential treatments for debilitating diseases in which muscle performance is compromised and/or declining. It is focused on the discovery and development of small molecule therapeutics that modulate muscle function for the treatment of serious diseases and medical conditions. The Company is developing small molecule drug candidates, which are specifically engineered to increase muscle function and contractility. The Company’s drug candidates, which are in clinical development include tirasemtiv, CK-2127107 and omecamtiv mecarbil.
Algorithmic traders utilize these daily forecasts by the I Know First market prediction system as a tool to enhance portfolio performance, verify their own analysis and act on market opportunities faster. This forecast was sent to current I Know First subscribers.
How to interpret this diagram
Algorithmic Stock Forecast: The table on the left is a stock forecast produced by I Know First’s algorithm. Each day, subscribers receive forecasts for six different time horizons. Note that the top 10 stocks in the 1-month forecast may be different than those in the 1-year forecast. In the included table, only the relevant stocks have been included. The boxes are arranged according to their respective signal and predictability values (see below for detailed definitions). A green box represents a positive forecast, suggesting a long position, while a red represents a negative forecast, suggesting a short position.
Please note-for trading decisions use the most recent forecast. Get today’s forecast and Top stock picks.


