
52 Week High Stocks Based on Artificial Intelligence: Returns up to 36.54% in 14 Days
52 Week High Stocks
The 52 Week High Stocks Package is designed for investors and analysts who need predictions for stocks currently at their 52-week high price level. It includes 20 stocks with bullish and bearish signals and indicates the best shares to buy and sell:
- 52 Weeks High Top 10 stocks for the long position
- 52 Weeks High Top 10 stocks for the short position
![]()
![]()
Package Name: 52 Week High Stocks
Recommended Positions: Long
Forecast Length: 14 Days (5/24/22 – 6/7/22)
I Know First Average: 11.16%

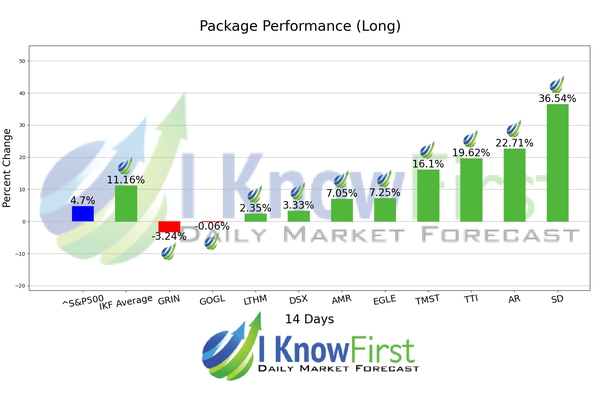
This 52 Week High Stocks Package forecast had correctly predicted 8 out of 10 stock movements. The greatest return came from SD at 36.54%. AR and TTI saw outstanding returns of 22.71% and 19.62%. The overall average return in this 52 Week High Stocks package was 11.16%, providing investors with a 6.46% premium over the S&P 500’s return of 4.7% during the same period.
SandRidge Energy, Inc. (SD), an energy company, engages in the exploration, development, and production of crude oil, natural gas, and natural gas liquids primarily in the area of Mid-Continent in Oklahoma and Kansas. The company’s Exploration and Production segment explores for, develops, and produces oil and natural gas properties; and operates wells. Its Midstream Services segment purchases, gathers, treats, and sells natural gas. As of December 31, 2015, it had 4,411 gross producing wells; approximately 2,063,000 gross total acres under lease; and estimated proved reserves were 324.6 million barrels of oil equivalent. The company is headquartered in Oklahoma City, Oklahoma.
Algorithmic traders utilize these daily forecasts by the I Know First market prediction system as a tool to enhance portfolio performance, verify their own analysis and act on market opportunities faster. This forecast was sent to current I Know First subscribers.
How to interpret this diagram
Algorithmic Stock Forecast: The table on the left is a stock forecast produced by I Know First’s algorithm. Each day, subscribers receive forecasts for six different time horizons. Note that the top 10 stocks in the 1-month forecast may be different than those in the 1-year forecast. In the included table, only the relevant stocks have been included. The boxes are arranged according to their respective signal and predictability values (see below for detailed definitions). A green box represents a positive forecast, suggesting a long position, while a red represents a negative forecast, suggesting a short position.
Please note-for trading decisions use the most recent forecast. Get today’s forecast and Top stock picks.


