
52 Week High Based on Big Data: Returns up to 46.45% in 1 Month
52 Week High
The 52 Week High Stocks Package is designed for investors and analysts who need predictions for stocks currently at their 52-week high price level. It includes 20 stocks with bullish and bearish signals and indicates the best shares to buy and sell:
- 52 Weeks High Top 10 stocks for the long position
- 52 Weeks High Top 10 stocks for the short position
![]()
![]()
Package Name: 52 Week High Stocks
Recommended Positions: Long
Forecast Length: 1 Month (2/23/22 – 3/23/22)
I Know First Average: 12.37%
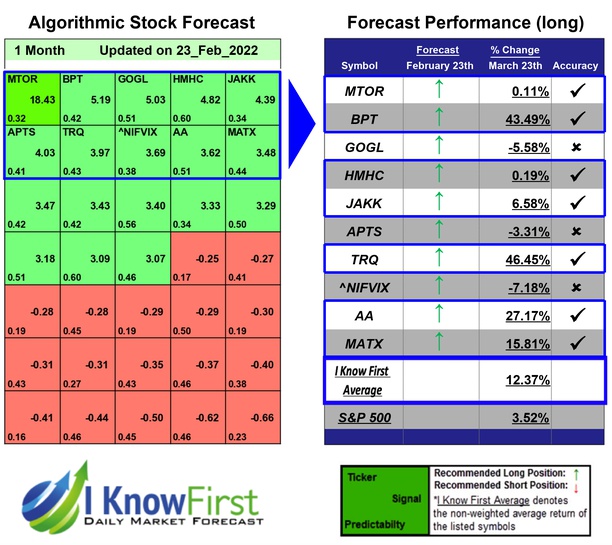

7 out of 10 stock prices in this forecast for the 52 Week High Stocks Package moved as predicted by the algorithm. The highest trade return came from TRQ, at 46.45%. BPT and AA also performed well for this time horizon with returns of 43.49% and 27.17%, respectively. The overall average return in this 52 Week High Stocks package was 12.37%, providing investors with a 8.85% premium over the S&P 500’s return of 3.52% during the same period.
Turquoise Hill Resources Ltd. (TRQ), together with its subsidiaries, operates as a mining company. The company engages in mining copper, gold, and silver. Its principal material mineral resource property is the Oyu Tolgoi copper-gold mine located in the southern Mongolia. The company was formerly known as Ivanhoe Mines Ltd. and changed its name to Turquoise Hill Resources Ltd. (TRQ) in August 2012. The company was founded in 1994 and is headquartered in Vancouver, Canada.
Algorithmic traders utilize these daily forecasts by the I Know First market prediction system as a tool to enhance portfolio performance, verify their own analysis and act on market opportunities faster. This forecast was sent to current I Know First subscribers.
How to interpret this diagram
Algorithmic Stock Forecast: The table on the left is a stock forecast produced by I Know First’s algorithm. Each day, subscribers receive forecasts for six different time horizons. Note that the top 10 stocks in the 1-month forecast may be different than those in the 1-year forecast. In the included table, only the relevant stocks have been included. The boxes are arranged according to their respective signal and predictability values (see below for detailed definitions). A green box represents a positive forecast, suggesting a long position, while a red represents a negative forecast, suggesting a short position.
Please note-for trading decisions use the most recent forecast. Get today’s forecast and Top stock picks.


