
52 Week High Based on Big Data Analytics: Returns up to 52.79% in 1 Month
52 Week High
The 52 Week High Stocks Package is designed for investors and analysts who need predictions for stocks currently at their 52-week high price level. It includes 20 stocks with bullish and bearish signals and indicates the best shares to buy and sell:
- 52 Weeks High Top 10 stocks for the long position
- 52 Weeks High Top 10 stocks for the short position
![]()
![]()
Package Name: 52 Week High Stocks
Recommended Positions: Long
Forecast Length: 1 Month (3/18/22 – 4/19/22)
I Know First Average: 9.13%

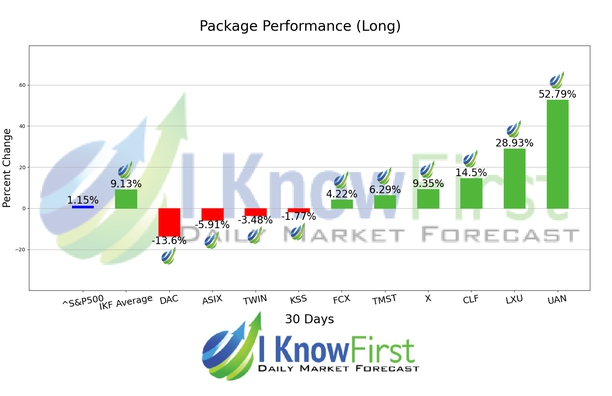
The algorithm correctly predicted 6 out of 10 the suggested trades in the 52 Week High Stocks Package for this 1 Month forecast. The highest trade return came from UAN, at 52.79%. The suggested trades for LXU and CLF also had notable 1 Month yields of 28.93% and 14.5%, respectively. The package’s overall average return was 9.13%, providing investors with a 7.98% premium over the S&P 500’s return of 1.15% during the same period.
CVR Partners, LP (UAN) produces, distributes, and markets nitrogen fertilizer products in North America. It provides ammonia products for industrial and agricultural customers; and urea ammonium nitrate products for agricultural customers. CVR GP, LLC serves as the general partner of the company. The company was founded in 2007 and is headquartered in Sugar Land, Texas. CVR Partners, LP (UAN) operates as a subsidiary of Coffeyville Resources LLC.
Algorithmic traders utilize these daily forecasts by the I Know First market prediction system as a tool to enhance portfolio performance, verify their own analysis and act on market opportunities faster. This forecast was sent to current I Know First subscribers.
How to interpret this diagram
Algorithmic Stock Forecast: The table on the left is a stock forecast produced by I Know First’s algorithm. Each day, subscribers receive forecasts for six different time horizons. Note that the top 10 stocks in the 1-month forecast may be different than those in the 1-year forecast. In the included table, only the relevant stocks have been included. The boxes are arranged according to their respective signal and predictability values (see below for detailed definitions). A green box represents a positive forecast, suggesting a long position, while a red represents a negative forecast, suggesting a short position.
Please note-for trading decisions use the most recent forecast. Get today’s forecast and Top stock picks.


