
52 Week High Based on Big Data Analytics: Returns up to 420.0% in 3 Months
52 Week High
The 52 Week High Stocks Package is designed for investors and analysts who need predictions for stocks currently at their 52-week high price level. It includes 20 stocks with bullish and bearish signals and indicates the best shares to buy and sell:
- 52 Weeks High Top 10 stocks for the long position
- 52 Weeks High Top 10 stocks for the short position
![]()
![]()
Package Name: 52 Week High Stocks
Recommended Positions: Long
Forecast Length: 3 Months (11/13/20 – 2/14/21)
I Know First Average: 75.61%
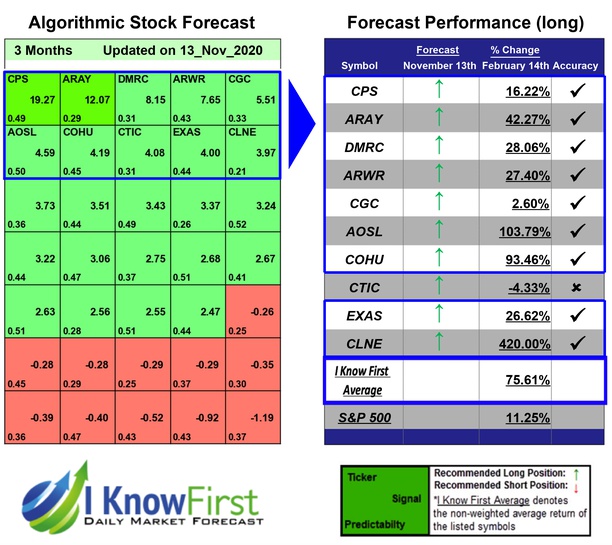
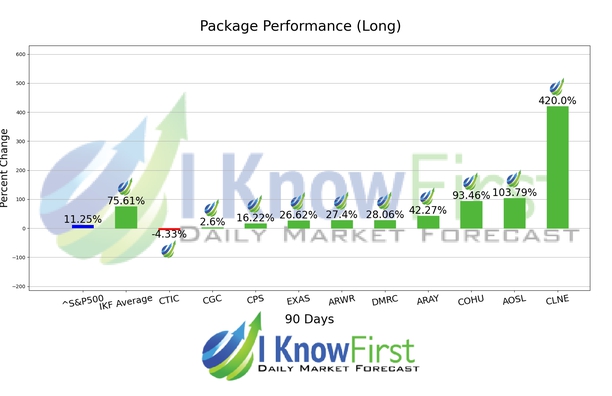
For this 3 Months forecast the algorithm had successfully predicted 9 out of 10 movements. CLNE was the top performing prediction with a return of 420.0%. Other notable stocks were AOSL and COHU with a return of 103.79% and 93.46%. The overall average return in this 52 Week High Stocks package was 75.61%, providing investors with a 64.36% premium over the S&P 500’s return of 11.25% during the same period.
Clean Energy Fuels Corp. (Clean Energy), incorporated on April 17, 2001, is a provider of natural gas as an alternative fuel for vehicle fleets in the United States and Canada. The Company is engaged in supplying compressed natural gas (CNG), liquefied natural gas (LNG) and renewable natural gas (RNG) for light, medium and heavy-duty vehicles, and providing operation and maintenance (O&M) services for natural gas fueling stations.
Algorithmic traders utilize these daily forecasts by the I Know First market prediction system as a tool to enhance portfolio performance, verify their own analysis and act on market opportunities faster. This forecast was sent to current I Know First subscribers.
How to interpret this diagram
Algorithmic Stock Forecast: The table on the left is a stock forecast produced by I Know First’s algorithm. Each day, subscribers receive forecasts for six different time horizons. Note that the top 10 stocks in the 1-month forecast may be different than those in the 1-year forecast. In the included table, only the relevant stocks have been included. The boxes are arranged according to their respective signal and predictability values (see below for detailed definitions). A green box represents a positive forecast, suggesting a long position, while a red represents a negative forecast, suggesting a short position.
Please note-for trading decisions use the most recent forecast. Get today’s forecast and Top stock picks.


