
52 Week High Based on Algo Trading: Returns up to 241.58% in 1 Year
52 Week High
The 52 Week High Stocks Package is designed for investors and analysts who need predictions for stocks currently at their 52-week high price level. It includes 20 stocks with bullish and bearish signals and indicates the best shares to buy and sell:
- 52 Weeks High Top 10 stocks for the long position
- 52 Weeks High Top 10 stocks for the short position
![]()
![]()
Package Name: 52 Week High Stocks
Recommended Positions: Long
Forecast Length: 1 Year (8/11/20 – 8/11/21)
I Know First Average: 77.82%

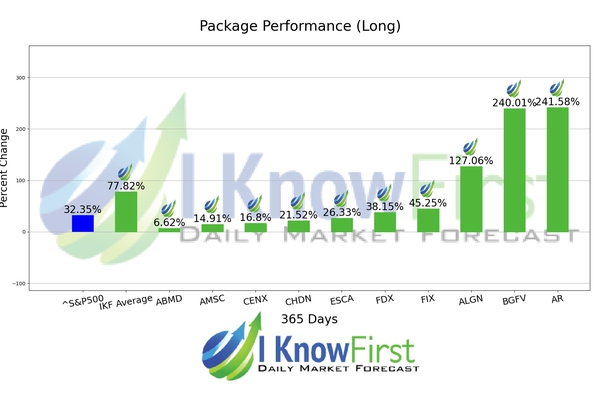
In this 1 Year forecast for the 52 Week High Stocks Package, there were many high performing trades and the algorithm correctly predicted 10 out of 10 trades. AR was the top performing prediction with a return of 241.58%. Further notable returns came from BGFV and ALGN at 240.01% and 127.06%, respectively. This algorithmic forecast package presented an overall return of 77.82% versus the S&P 500’s performance of 32.35% providing a market premium of 45.47%.
Antero Resources Corporation (AR), an independent oil and natural gas company, acquires, explores, and develops natural gas, natural gas liquids, and oil properties in the United States. The company was formerly known as Antero Resources Appalachian Corporation and changed its name to Antero Resources Corporation (AR) in June 2013. Antero Resources Corporation (AR) was founded in 2002 and is headquartered in Denver, Colorado. Antero Resources Corporation operates as a subsidiary of Antero Resources Investment LLC.
Algorithmic traders utilize these daily forecasts by the I Know First market prediction system as a tool to enhance portfolio performance, verify their own analysis and act on market opportunities faster. This forecast was sent to current I Know First subscribers.
How to interpret this diagram
Algorithmic Stock Forecast: The table on the left is a stock forecast produced by I Know First’s algorithm. Each day, subscribers receive forecasts for six different time horizons. Note that the top 10 stocks in the 1-month forecast may be different than those in the 1-year forecast. In the included table, only the relevant stocks have been included. The boxes are arranged according to their respective signal and predictability values (see below for detailed definitions). A green box represents a positive forecast, suggesting a long position, while a red represents a negative forecast, suggesting a short position.
Please note-for trading decisions use the most recent forecast. Get today’s forecast and Top stock picks.


