
52 Week High Based on a Self-learning Algorithm: Returns up to 99.69% in 1 Year
52 Week High
The 52 Week High Stocks Package is designed for investors and analysts who need predictions for stocks currently at their 52-week high price level. It includes 20 stocks with bullish and bearish signals and indicates the best shares to buy and sell:
- 52 Weeks High Top 10 stocks for the long position
- 52 Weeks High Top 10 stocks for the short position
![]()
![]()
Package Name: 52 Week High Stocks
Recommended Positions: Long
Forecast Length: 1 Year (10/11/20 – 10/11/21)
I Know First Average: 31.83%
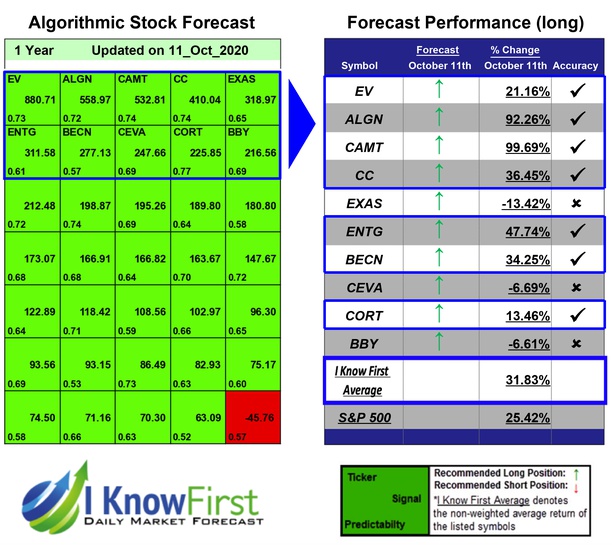
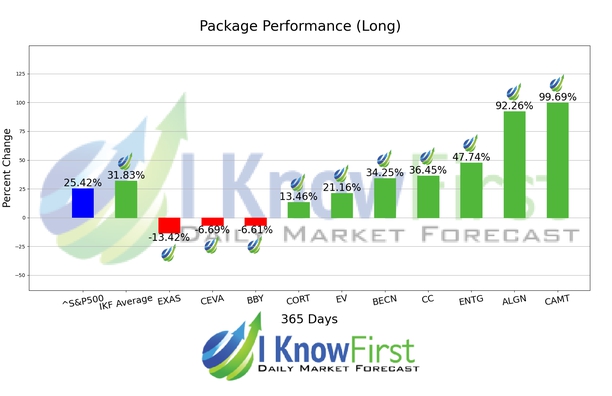
The algorithm correctly predicted 7 out 10 of the suggested trades in the 52 Week High Stocks Package for this 1 Year forecast. The highest trade return came from CAMT, at 99.69%. ALGN, and ENTG had notable returns of 92.26% and 47.74%. The package itself saw an overall return of 31.83%, providing investors with a 6.41% premium above the S&P 500’s return of 25.42% for the same time period.
Camtek Ltd. designs, develops, manufactures, and markets automated optical inspection (AOI) systems for semiconductor wafers, integrated circuit substrates, and printed circuit boards (PCBs) in Israel. It operates in two segments, Microelectronics and PCB. The company was founded in 1987 and is headquartered in Migdal HaEmek, Israel.
Algorithmic traders utilize these daily forecasts by the I Know First market prediction system as a tool to enhance portfolio performance, verify their own analysis and act on market opportunities faster. This forecast was sent to current I Know First subscribers.
How to interpret this diagram
Algorithmic Stock Forecast: The table on the left is a stock forecast produced by I Know First’s algorithm. Each day, subscribers receive forecasts for six different time horizons. Note that the top 10 stocks in the 1-month forecast may be different than those in the 1-year forecast. In the included table, only the relevant stocks have been included. The boxes are arranged according to their respective signal and predictability values (see below for detailed definitions). A green box represents a positive forecast, suggesting a long position, while a red represents a negative forecast, suggesting a short position.
Please note-for trading decisions use the most recent forecast. Get today’s forecast and Top stock picks.


