Crude Oil forecast and the forecast for the major commodities: Gold , Silver and based on "I Know First" predictive Algorithm. Forecast date: October 7 2012. Time horizon of the forecast: 30 trading days from October 7 2012. The forecast includes predictions for:
The chart includes the system signal and the actual move of apple. All through July and August AAPL gave weak down (sell) signals that became strong at the end of August and the first week of September. That was the time to sell. We always recommend acting on strong signals. Afterwards the signals stopped due to internal logic filters. . The shorter time range charts showed the same signals
The previous article introduced the basics of the I Know First stock forecast algorithm.
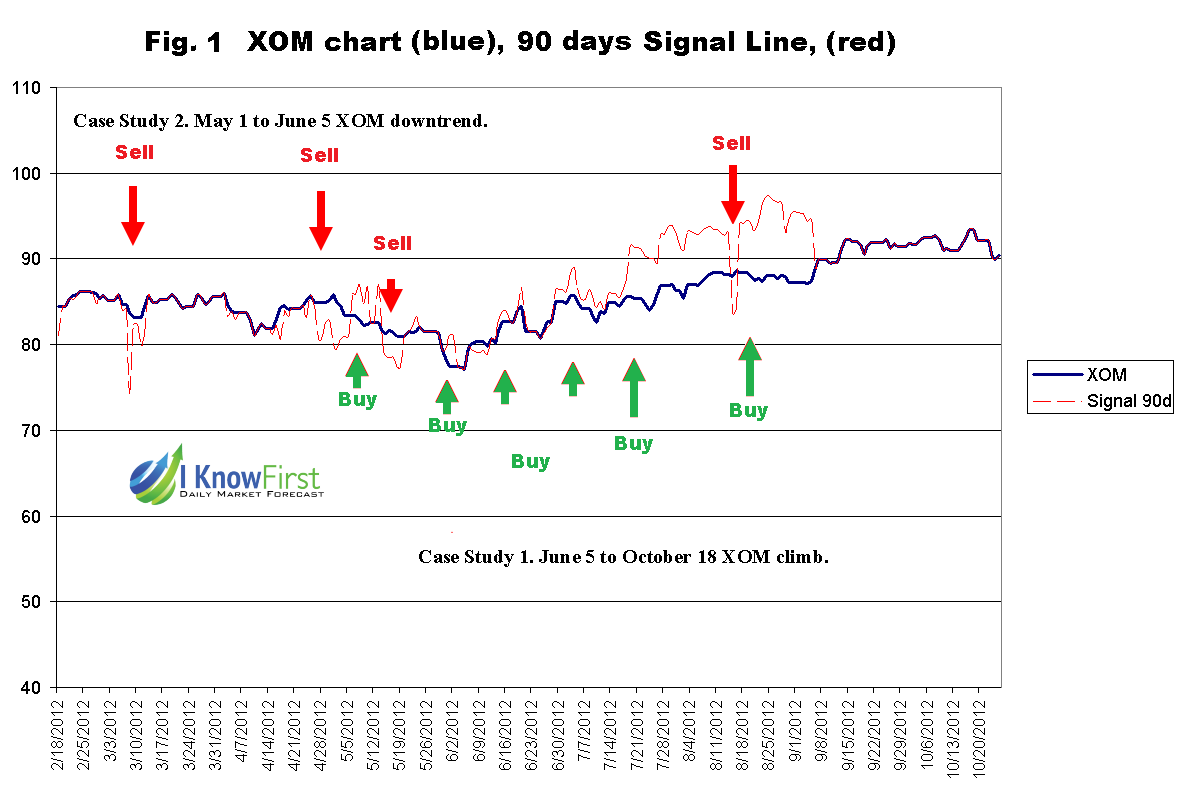
The charts below (Figs. 1 and 2) present the system actual performance on Exxon Mobil (XOM ) price prediction. Fig. 1 shows the 90 days forecast, Fig. 2 the 30 days forecast. The thick blue line shows the actual price. The thin broken red line on the chart is the signal line. The positive or negative (up or down) signals of the forecast were added to the actual last known price at the time of forecast. Thus, when the signal line is above the actual line, it means "buy", if below, then "sell". Each point on this chart was taken from the actual daily forecast published in the morning before the next market open. Each forecast consists of six forecasts for six time horizons, from three days to one year ahead.
(click to enlarge)
Case Study 1. June 5 to October 18 XOM climb.
Recently Exxon Mobil Corporation XOM climbed 20 percent from the bottom price of $77.6 on June 5, to a peak of 93.48 on October 18, before pulling back to 89.88 by October 24.
XOM began showing a weak up signal at first in the 90 days time horizon forecast (See Fig. 1, the right part) on June 2, then a stronger signal on June 29, then by mid July it was already signaling the upcoming uptrend in the 30 days (Figs 2) and on the short term forecasts (not shown here).
(click to
I Know First-Daily Market Forecast, does not provide personal investment or financial advice to individuals, or act as personal financial, legal, or institutional investment advisors, or individually advocate the purchase or sale of any security or investment or the use of any particular financial strategy. All investing, stock forecasts and investment strategies include the risk of loss for some or even all of your capital. Before pursuing any financial strategies discussed on this website, you should always consult with a licensed financial advisor.