Yahoo Stock Forecast: Yahoo Uses Asia to Become Competitive
Yahoo uses Asia to Become Competitive
Date: November 16, 2014
Yahoo (Nasdaq:YHOO) stock has shown bullish behavior for  the past few months now, dating back to the end of June. In fact, Yahoo stock has gained 51% since I Know First suggested it as a stock that was undervalued. Yahoo is a global Internet services company that offers varied products and content, ranging from email and search to media streaming and downloads. Yahoo’s main revenue source is advertising and marketing services, but they recently acquired a great deal of cash on hand thanks to Asia.
Yahoo Gains Much Needed Assets
Back in 2005, Yahoo purchased 40% of Alibaba (NYSE:BABA) for $1 billion USD. Since, Alibaba has gone public, and Yahoo has been able to use their shares to fund their future. At the time of the record breaking IPO, Yahoo had a 22.4% stake in the Chinese e-commerce giant. Yahoo sold 140 million of their shares in Alibaba during the September IPO at $68 a share, raking in $9.4 billion, pre-taxes. The company gained a net profit of $6.3 billion, which was a vast majority of the $6.8 billion the company made in net earnings. Yahoo decided not to wait for after the IPO sold, passing up the chance to earn more when the stock was selling at $95 a share or more.
Yahoo still has assets besides their recent cash windfall. Their shares in Alibaba along with Yahoo Japan represent almost all of them. They still have a 16% stake in Alibaba, worth approximately $35.1 billion, as well as a 35% stake in Yahoo Japan valued at $7.4 billion. CEO Marissa Mayer has used some of these assets to fund her future vision for the company.
Yahoo’s Path for Returning to Prominence
Over the past few years, Yahoo has struggled as their online desktop marketing share has decreased, while rivals Google (NASDAQ:GOOG) and Facebook (NASDAQ:FB) have grown. Yahoo is attempting to transition from desktop to mobile ads, which is growing faster than any other sector of marketing. Yahoo recently acquired BrightRoll, a platform for selling and delivering video advertisements, for $640 million, their second largest purchase since Mayer took over. The video platform will allow marketers to buy ads in real time across many sites.

The most expensive purchase Yahoo CEO Marissa Mayer has acquired at Yahoo is the blogging site Tumblr, an extremely popular site among younger demographics, for $1.1 billion. Mayer has recently claimed that Tumblr is expected to generate over $100 million in revenues in 2015. The Tumblr and Yahoo mobile pages now get 550 million active users on mobile, a 17% increase over a year ago.
These purchases, along with Mayer’s increased emphasis on mobile ads since she became CEO, has allowed Yahoo to become the third largest company in terms of mobile ads, only behind Google and Facebook. They were even able to pass Twitter (NYSE:TWTR), and have similar growth. Mobile ads have yet to be optimized, and Yahoo now has an advantage over competitors. BrightRoll is the leader in its field, and may allow Yahoo to catapult to the number one position in terms of ads served in the United States. By focusing on mobile ads, which Mayer has the resources to shift to thanks to Yahoo’s Asian assets, Yahoo has solid potential for future growth.
Algorithmic Analysis (Explanation)
I Know First’s algorithm was able to correctly forecast that Yahoo stock was undervalued and would gain value over the next three months. On June 30th, I Know First published an article on Seeking Alpha titled “Bullish Algorithmic Forecast For Yahoo Around The Alibaba IPO”. The article explained how not only did the algorithm predict that Yahoo stock was undervalued, but how independent analysis involving the Alibaba IPO as well as market factors made Yahoo stock very appealing to investors. As shown above, this proved to be correct, as Yahoo stock has continued to show bullish behavior.

I Know First is a financial services firm that utilizes an advanced self-learning algorithm to analyze, model and predict the stock market. The algorithm produces a forecast with a signal and a predictability indicator. The signal is the number in the middle of the box. The predictability is the number at the bottom of the box. At the top, a specific asset is identified. This format is consistent across all predictions.
Signal Explanation
This indicator represents the predicted movement direction/trend; not a percentage or specific target price. The signal strength indicates how much the current price deviates from what the system considers an equilibrium or “fair” price. The signal strength is the absolute value of the current prediction of the system. The signal can have a positive (predicted increase), or negative (predicted decline) sign. The heat map is arranged according to the signal strength with strongest up signals at the top, while down signals are at the bottom. The table colors are indicative of the signal. Green corresponds to the positive signal and red indicates a negative signal. A deeper color means a stronger signal and a lighter color equals a weaker signal.
Analogy with a spring: The signal strength is how much the spring is stretched. The higher is the tension the more it’ll move when the spring is released.
Predictability Explanation
This measures the importance of the signal. The predictability is the historical correlation between the prediction and the actual market movement for that particular asset, which is recalculated daily. Theoretically the predictability ranges from minus one to plus one. The higher this number is the more predictable the particular asset is. If you compare predictability for different time ranges, you’ll find that the longer time ranges have higher predictability. This means that longer-range signals are more important and tend to be more accurate.
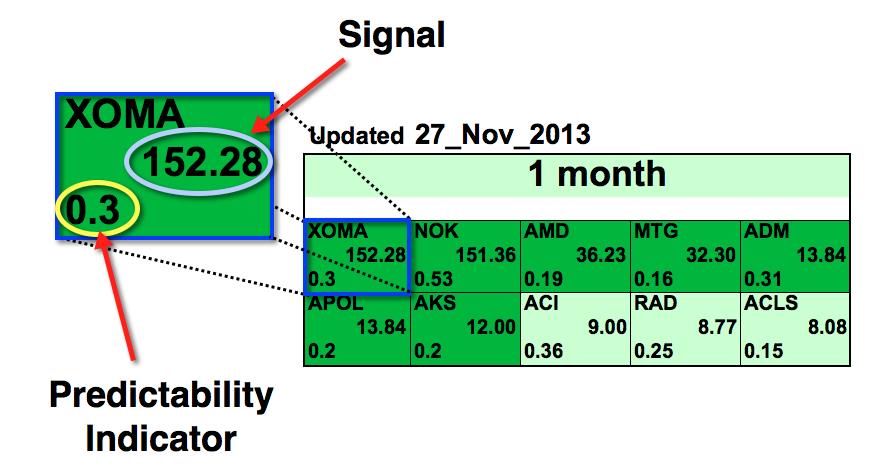
Source: Example of an I Know First algorithmic heat map.
In this particular Top 10 Stocks Forecast from November 27th 2013, XOMA had the strongest 1-month signal but did not have the strongest predictability. As the asset is in a deeper green color box, this indicates that the algorithm is very bullish.
The algorithm does not only predict the strongest signals, but also the weakest. If this is a market bubble the algorithm will be able to shift its prediction to a strong negative one, allowing investors to make gains on both the price appreciation and depreciation (by shorting the stock).
I Know First Research is the analytic branch of I Know First, a financial startup company that specializes in quantitatively predicting the stock market. This article was written by Daniel Hai, one of our interns. We did not receive compensation for this article, and we have no business relationship with any company whose stock is mentioned in this article.
Want to see similar returns in your portfolio? Test our algorithm and let us identify the best market opportunities for you. The above mentioned small cap and dividend forecast are but a small portion of I Know First Financial Services List.
To learn more about our product please use the following links
For information about private investor products click here
For information about institutional investor products click here
For the most recent I Know First Research articles and news click here
Want to know just how accurate our predictions are ? click here
Contact us with any questions: [email protected]
Are you the professional able to position I Know First as the top choice for today’s investor. Explore career opportunities available now to join our team: latest jobs.