Stock Market Forecast For 2016 Based On A Predictive Algorithm
 Omri Elani is a Junior Business Developer & Research Analyst for I Know First. Also a frequent contributor for the investment research website Seeking Alpha.
Stock Market Forecast For 2016 Based On A Predictive Algorithm
December 1st, 2015.
Summary
- Review

 of the market performance in the global financial market during 2015.
 - Detailed US market analysis, highlighting what Goldman Sachs and other leading banks are predicting.
- How I Know First predicted 2015’s performance.
- Stock market forecast for the short, mid, and long-term based on our predictive algorithms in 2016.
2015, so what happened
2015 was a year of mixed outcomes in the finance field. The year started with the Greek debt crisis, which had many world leaders scrambling for ideas on how to resolve the issue. Towards the summer of 2015, the Chinese economy came into play, producing phenomenal growth results, however, raised skepticism with many, as speculation grew about China’s ability to maintain such stunning growth. Commodity prices have also been hit hard in 2015, with the rapid decline in oil prices. Furthermore, sustainable development has also had a monumental year, as explained by the chief executive of Alliance Trust fund management, Katherine Garrett-Cox, 2015 is “a huge year for sustainable development”, referring to December’s COP21 climate change conference.
2016 Outlook US Economic Analysis
The US economic growth for the third quarter of 2015 has been portrayed as positive following strong investment and house building. The gross domestic product rose at an annual pace of 2.1% unlike what was mistakenly reported a month earlier at 1.5%. However, the now higher number still shows that the GDP growth is not on par with the annual pace of 3.9% in the second quarter. Although, it is important to note that despite the positive gain, investors should be wary of the fact that inventory levels are accelerating.
A senior economist at BMO Capital Markets has talked about the stable US market saying “Domestic demand in the US economy remains very solid, something that will surely give comfort to the Fed as it ponders its next move”.
According to a few of the major banks, the supply side of the economy continues to disappoint. For several years now it has been argued that the potential yearly growth rate in the US is quite low, estimated at around 1.75%.
Confirmation of this view has come through the fact that US growth has been averaging less than 2.5% over the past few years, which has been enough to substantially lower the unemployment rate.
If one looks at the situation from a purely macro view, the combined effect of the fiscal and monetary policy is likely to exert no more restraint on growth than it did in the 2011-2014 period, when fiscal policy was consistently presenting a significant headwind to the economy.
Moreover, the US dollar is expected to rise in the near future. Major banks do expect a growth in GDP in the coming year. Their estimates come in at around 2.30% growth for the coming year. The third quarter results will add to speculation that the US Federal Reserve is ready to raise interest rates next month.
Indices review for 2016
The Standard & Poor’s 500 has been on thin ice in 2015, and according to Goldman Sachs. Goldman has forecasted that the index will trade at the 2,100 level at the end of 2016, as rising rates compress P/E multiples, weighing on stocks even as companies’ earnings grow. This was the level the S&P traded at this time last month. Furthermore, Goldman predicts the US stock market will continue to trade sideward in the next year with interest rates set to rise faster than many investors depicted.
According to Savita Subramanian, head of U.S equity strategy and U.S. quantitative strategy, the Standard & Poor’s 500-stock index will reach 2,200 in 2016. She even goes on to add an overly ambitious target for the year 2025 stating that the target price for the index will be 3,500. The Standard & Poor’s 500 Index remains more than 1 percent from its May 21 peak of 2,130.82
The Dow Jones has fluctuated over the year due to falling oil prices and most recently the inexplicable Chinese market. The index, however, produced a strong performance as of late due to stronger than expected third-quarter GDP report. The news offsets new consumer sentiment, which hit its lowest level in 14 months.
Further, highlighting the robust economic climate is seen through the booming Nasdaq 100 Index which was above its July high and toward record territory. The index’s 1.2 percent advance extended its rally from the Aug. 25 trough to 17 percent, making it the first major index of U.S. stocks to retake a multiyear high established earlier in 2015.
What I Know First Algorithm predicted for 2015 and Forecast for 2016
I Know First utilizes an advanced algorithm based on artificial intelligence and machine learning to predict market performance for over 1,400 markets including stock forecasts, world indices, commodities, interest rates, ETFs, and currencies. The system follows the flow of money from one market into another.
Figure 1 below shows the algorithm’s prediction for 2015, published on Seeking Alpha, on the December 17th, 2014.

Explanation about how to read the forecast is further elaborated here.
As can be seen from the figure above, the algorithm forecasted a bullish trend for all three indexes for the three-time periods.
1 Month Forecast Performance Review
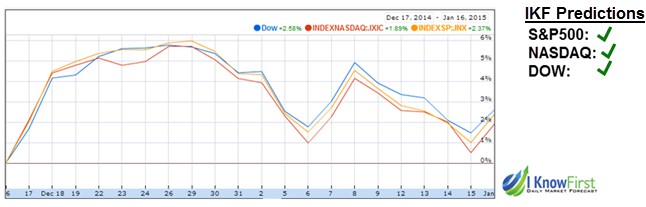
The diagram above shows the performance review of the 1-month forecast relating to figure 1.
As can be seen, the algorithm forecast a bullish market for all three indexes for the 1 month time horizon. The Algorithm was correct. One sees how the NASDAQ (IXIC) gained 1.89%, S&P 500 gained 2.37%, and Dow Jones gained 2.58%
3 Months Forecast Performance Review

The Figure above shows the performance review of the 3-month forecast relating to figure 1.
Again the algorithm was correct. One can see how the IKF forecast was bullish on the three index and indeed this was the case. One sees how the NASDAQ (IXIC) gained 8.83%, S&P 500 gained 5.50%, and Dow Jones gained 5.32%
YTD Review
In order to assess growth this past year, Chart 1 shows the return on the three indexes a year to date.
When comparing the one year forecast to the actual YTD results in the stock market, one can see how the algorithm correctly predicted 2 out of 3 indexes correctly. The Nasdaq Composite grew by 7.03% while the S&P 500 increased by 0.12%.
Let us assume an investor divided his portfolio’s risks according to time rather than variation of assets, if one were to use the 3 forecasts, I Know First’s returns would be as follows:

Thus, the above shows the yields achieved by I Know First algorithm based on actual market returns and predictions from figure 1. It can be seen how the matrix above produced positive returns on all averages.
I Know First Algorithm Forecast for 2016
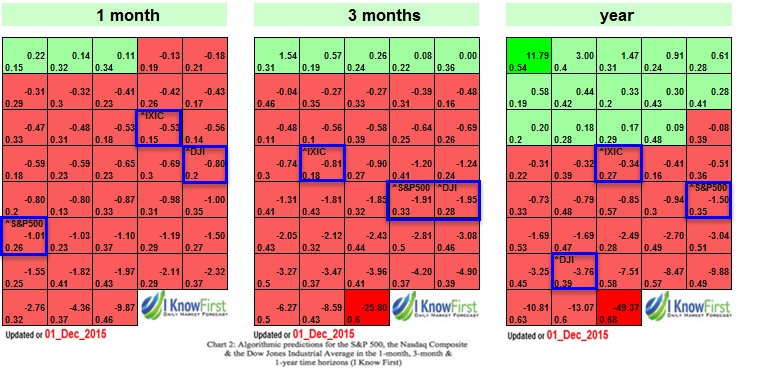
In chart 2 below one can see, I Know First’s forecast predictions for 2016, published on December 1st, 2015.
The algorithm denotes a short position on the Nasdaq Composite, Dow Jones Industrial average and the Standard & Poor’s 500 for the 1-year time horizon. In the 3-month time horizon, the algorithm is showing a bearish position for the three indices, and likewise for the 1-month prediction.
Chart 2 below shows a type of output from the algorithm in the form of a heat map. In each box of the heat map, there is the ticker symbol, the signal, and the predictability indicator. When reading this forecast, please note that forecasts with longer time horizons tend to be more accurate than short-term predictions.
Conclusion
I Know First’s algorithm is currently denoting a short position on the Nasdaq Composite, Dow Jones Industrial average and the Standard & Poor’s 500 for the 1-year time horizon and a short position for the 1-month and 3-month time horizons. It is likely to be an interesting year in the global financial world with mixed speculation as to which direction the economy will go.
Follow up: December 15th, 2015
Given the information provided in our predictive forecast dating December 1st, 2015, our algorithm predictive a downwards trends for the DJI, the IXIC, and the S&P500. When analyzing the short-term performance of these stocks one can see how the algorithm was correct in foreseeing these negative trends. Our forecast predicted a negative tendency for the one month period indicated by the bearish red tickers in chart 2.
Although only two weeks have passed since the publication, a downwards trend can be seen, as are illustrated by the chart below.

S&P500 –Fell by -3.29%.
NASDAQ –Fell by -3.46%
DJI–Fell by -2.38%.
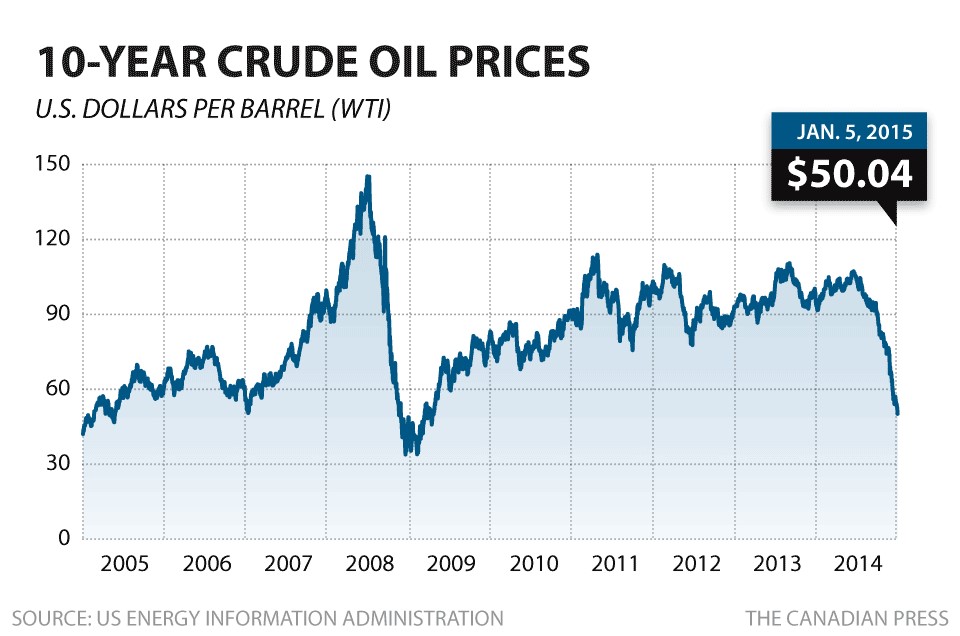
The reasoning for the fall in indexes is thought to be due to the dramatic decline in US crude oil which fell below $36 a barrel. As well as the rising uncertainty in the bonds market. Moreover, the many investors are caution as to the upcoming Federal Reserve meeting today in which a rise in interest rates is expected.
Below the I Know First the one month forecast for these indexes, dating the 15th of December, is illustrated. One can see how the algorithm still maintains a downwards for the DJI and as well as the S&P500 however, a slightly more positive outlook is seen for the NASDAQ.

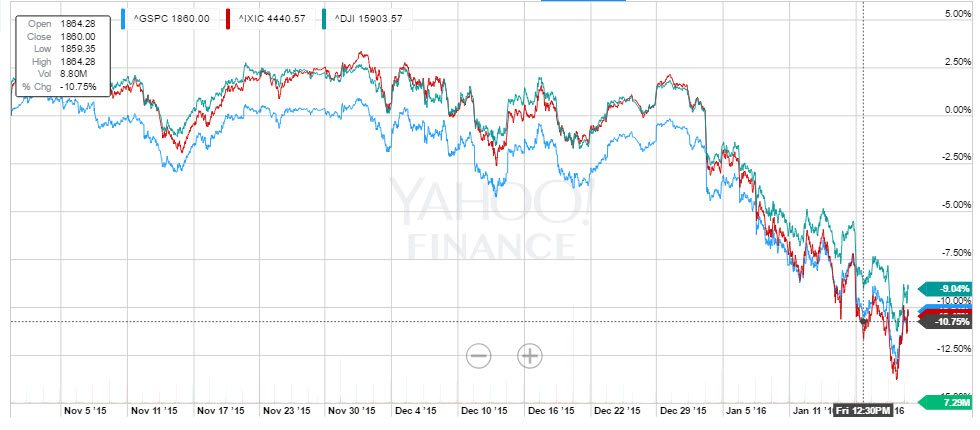
Follow Up: January 21st, 2016
A second follow-up from the December 1st, 2015, where the algorithm predicted a downwards trends for the DJI, the IXIC, and the S&P500. Since the market crash, we saw a week ago it was necessary to follow up with the algorithmic bearish signals that the algorithm produced.
We can observe in the following chart that the S&P500, IXIC, and DJI are still on the downfall and since the article was written they went down even further as the algorithm correctly predicted.
S&P500 –Fell by -10.63%.
NASDAQ –Fell by -12.47%
DJI–Fell by -11.02%
A month and 21 days have passed since the publication, a downwards trend can be seen, as are illustrated by the chart below.
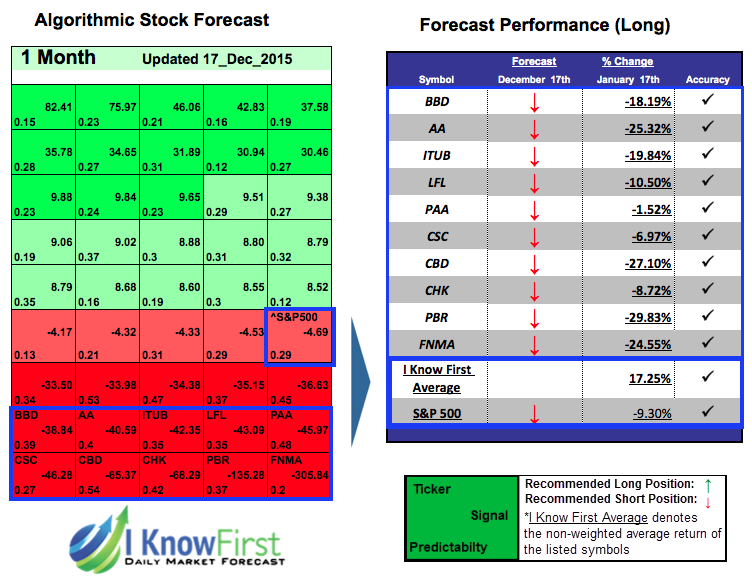
The algorithm predicted also predicted a bearish market for various indices as we can see under. The accuracy of the algorithm was 18 out of 20 bearish signals were predicted correctly. Bringing returns of up to 11.81% in a month.

We can also see stock forecasts from different time frames (14 Days, 1 Month and 3 months) which all were predicted to have bearish signals for the market direction. The S&P500 in all the three cases was predicted accurately by the algorithm, in addition, the top stocks that brought the best returns were the short positions of Freeport-McMoRan Inc (FCX) with 66.54%, Chesapeake Energy Corporation (CHK) with 57.37%, Petróleo Brasileiro S.A. – Petrobras (PBR) with 29.83%, Companhia Brasileira de Distribuicao (CBD) with 27.10%, Alcoa Inc. (AA) with25.32% and 29.62%. The I Know First Averages are all above the S&P500 of-7.09%, -9.30% and –9.05% with magnificent returns of 28.28%, 17.25% and17.42% in the predicted time horizons.